HOT TOPICS LIST
- MACD
- Fibonacci
- RSI
- Gann
- ADXR
- Stochastics
- Volume
- Triangles
- Futures
- Cycles
- Volatility
- ZIGZAG
- MESA
- Retracement
- Aroon
INDICATORS LIST
LIST OF TOPICS
PRINT THIS ARTICLE
by Gary Grosschadl
The strongest reason for the overall markets to stall can be found on this weekly chart. If The Nasdaq stalls here and stumbles, the others will likely follow.
Position: N/A
Gary Grosschadl
Independent Canadian equities trader and technical analyst based in Peterborough
Ontario, Canada.
PRINT THIS ARTICLE
CHART ANALYSIS
Weekly Nasdaq Hits The Wall
09/16/03 10:10:52 AMby Gary Grosschadl
The strongest reason for the overall markets to stall can be found on this weekly chart. If The Nasdaq stalls here and stumbles, the others will likely follow.
Position: N/A
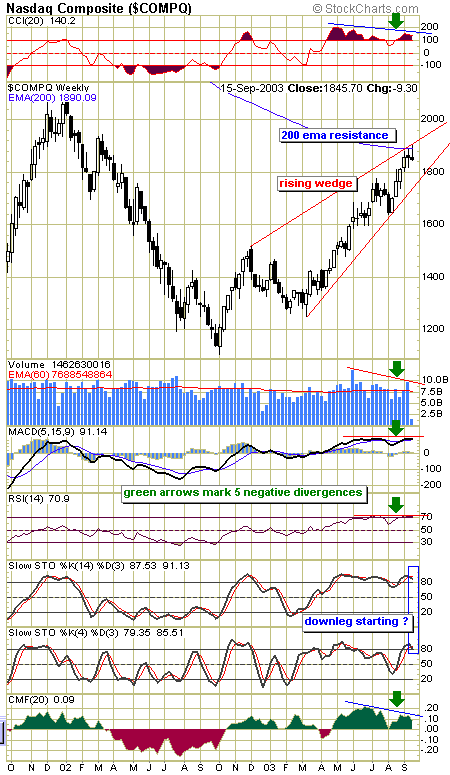
| The indices seem to have stalled a bit -- looking at the chart below, it is no wonder. The Nasdaq has been the big leader thus far with its unmatched exuberance. Perhaps now the Nasdaq is faced with a formidable challenge, this being the ever powerful 200-period EMA. Traders have learned to respect the 200-period moving averages in all time frames as reversals often occur here and no doubt trading targets are placed here as well. |

|
| Nasdaq's weekly chart showing several reasons for concern. |
| Graphic provided by: Stockcharts.com. |
| |
| No trader should go with any single indicator but rather look for a weight of evidence from a number of trading tools. So with this in mind I've included several other indicators in my analysis. To begin with, there is a potential bearish rising wedge shown on the chart. A move below the lower trendline on large volume would be a signal that a breakdown is likely underway. A move to test this lower trendline would entail a move down to 1760. A move past the upper trendline would be a bullish signal negating the bearish warning of the wedge. With the 200-period EMA coinciding with the upper trendline there is added resistance, making a move either way potentially noteworthy. |
| My other concerns are the multiple negative divergences and stochastics. Any time several negative divergences are occuring, the notion of a correction of some sort is more compelling. The five green arrows mark the various convergences. As the Nasdaq has pushed higher, these indicators have failed to follow suit and in so doing, cast doubt in this latest bullish move being sustainable. Two of the more compelling divergences come from lower volume (most obvious from smaller spikes) and the Chaiken money flow indicator hitting a lower high. Both of these point to less conviction coming from buyers at a point where the index is straining higher. |
| Lastly the stochastics series are in overbought territory. A shorter term series is displayed with the more commonly used 14-period setting. I often note that bigger moves occur when both of these move in tandem from either overbought or oversold levels. A move below the 80 level from both series would imply a more serious stochastic downleg. In this case that would be a move down to oversold levels of 20 or less. In summary, a strong move either way past the wedge's trendlines should make for a potentially substantial move. Right now the weight of evidence seems to favor the bears but as always the market will have the final say. |
Independent Canadian equities trader and technical analyst based in Peterborough
Ontario, Canada.
| Website: | www.whatsonsale.ca/financial.html |
| E-mail address: | gwg7@sympatico.ca |
Click here for more information about our publications!
Comments
Date: 09/28/03Rank: 5Comment:

Request Information From Our Sponsors
- VectorVest, Inc.
- Executive Premier Workshop
- One-Day Options Course
- OptionsPro
- Retirement Income Workshop
- Sure-Fire Trading Systems (VectorVest, Inc.)
- Trading as a Business Workshop
- VectorVest 7 EOD
- VectorVest 7 RealTime/IntraDay
- VectorVest AutoTester
- VectorVest Educational Services
- VectorVest OnLine
- VectorVest Options Analyzer
- VectorVest ProGraphics v6.0
- VectorVest ProTrader 7
- VectorVest RealTime Derby Tool
- VectorVest Simulator
- VectorVest Variator
- VectorVest Watchdog
- StockCharts.com, Inc.
- Candle Patterns
- Candlestick Charting Explained
- Intermarket Technical Analysis
- John Murphy on Chart Analysis
- John Murphy's Chart Pattern Recognition
- John Murphy's Market Message
- MurphyExplainsMarketAnalysis-Intermarket Analysis
- MurphyExplainsMarketAnalysis-Visual Analysis
- StockCharts.com
- Technical Analysis of the Financial Markets
- The Visual Investor
