HOT TOPICS LIST
- MACD
- Fibonacci
- RSI
- Gann
- ADXR
- Stochastics
- Volume
- Triangles
- Futures
- Cycles
- Volatility
- ZIGZAG
- MESA
- Retracement
- Aroon
INDICATORS LIST
LIST OF TOPICS
PRINT THIS ARTICLE
by David Penn
A late summer consolidation in 10-year Treasury yields may point to a long, waited-for bounce in government long bonds.
Position: N/A
David Penn
Technical Writer for Technical Analysis of STOCKS & COMMODITIES magazine, Working-Money.com, and Traders.com Advantage.
PRINT THIS ARTICLE
REVERSAL
Toward A Temporary Yield Top?
09/16/03 10:12:26 AMby David Penn
A late summer consolidation in 10-year Treasury yields may point to a long, waited-for bounce in government long bonds.
Position: N/A
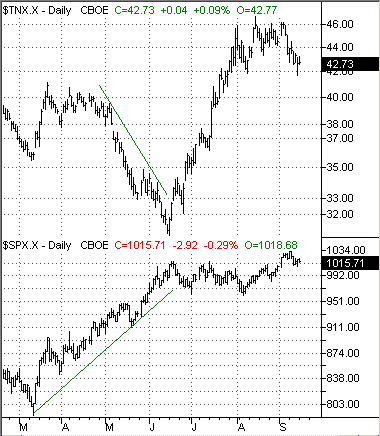
| The phenomena of rising interest rates has captured the imaginations (and anxieties) of investors and traders, analysts and commentators everywhere. Those who reject the deflation thesis -- whether Alan Greenspan's version or Bob Prechter's -- no doubt seen in the 48% increase in the 10-year Treasury note yield index further evidence that it is inflation, not deflation, that is the more pressing economic concern. The Second Half Recovery Crowd, on the other hand, has taken the rising interest rate trend, as short as it has been, as evidence that the Federal Reserve's reflation campaign is working. With rising rates and a rising stock market, say the SHR Crowd, the Fed has engineered a classic, anti-deflationary recovery (see my article "Gibson's Paradox," Working-Money.com, March 26, 2002, for more on this phenomenon or, more recently, "The Gold Triangle," Working-Money.com, September 10, 2003). |
| Never mind that the stock market actually peaked at the same time that interest rates bottomed. And while you're at it, feel free to ignore the fact that during the time that interest rates have been rising, the stock market has actually been in a trading range. So perhaps the market is actually reflecting more recent historical disinflationary trends, such as falling interest rates being bullish for financial assets such as stocks, than it is a reflationary recovery in an environment of deflationary risk. In either event, it looks like this scenario will be put to the test as interest rates -- as reflected by the 10-year Treasury note yield index ($TNX) -- appear to be marking an intermediate top as they consolidate between 45.64 and 41.73. |

|
| Figure 1: Do rising interest rates augur financial recovery. Stocks peaked as interest rates bottomed in mid-June. |
| Graphic provided by: TradeStation. |
| |
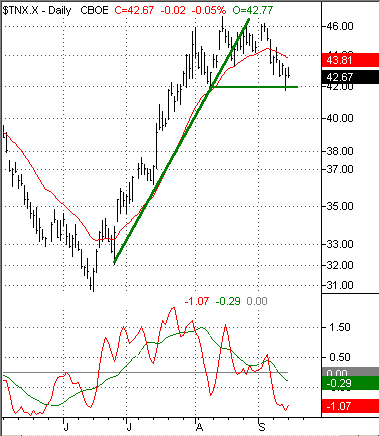
| Bearishness in the $TNX is also apparent in the behavior of the 3/10 oscillator, an indicator developed by Linda Bradford Raschke (see her book Street Smarts, co-authored by Lawrence Connors). Note in particular the negative divergence that begins in late July and is "confirmed" by the lower oscillator peak in mid-August vis-a-vis price action over the same periods. A further case for bearishness in government long bond yields over the intermediate term comes in the form of the 1-2-3 trend reversal -- a market analysis technique championed by Victor Sperandeo (Methods of a Wall Street Master). I have written about this technique frequently for Traders.com Advantage, but suffice it to say that the prospect of a 1-2-3 trend reversal has developed with the trendline break in mid-August (1), and an attempt by prices to resume the bull market late in the month (2) that appears to be failing in mid-September with a break beneath the highest correction low before the highest high of the bull market (3). |
| Before talking about the downside potential in the $TNX, I should point out that the 3/10 oscillator also reflects a particularly oversold market at this point. This underscores the likelihood of $TNX "bouncing" from nearby support -- here at approximately 42.00 -- before any downside break occurs. Such a bounce may, for example, cause the mid-July to present consolidation to take the form of a head and shoulders top -- the bounce potentially manifesting the right shoulder of such a reversal formation. This, of course, would not change the downside potential in the $TNX. But it would suggest that some time may be necessary before the $TNX is sufficiently oversold to make a lasting break to the downside. |
 Figure 2: A consolidation at the end of this 48% rally and an oversold indicator suggest that the break in the 10-year Treasury note yield index may be close--but not here yet. With regard to the downside, there appears to be significant support at about 37.00. This support corresponds also to a downside projection based on Weinstein's swing rule, which calls for subtracting formation size from the value at support. In this instance, a formation size of 03.89 subtracted from the support level of 41.73 points to a downside to 37.84 in an initial move. |
Technical Writer for Technical Analysis of STOCKS & COMMODITIES magazine, Working-Money.com, and Traders.com Advantage.
| Title: | Technical Writer |
| Company: | Technical Analysis, Inc. |
| Address: | 4757 California Avenue SW |
| Seattle, WA 98116 | |
| Phone # for sales: | 206 938 0570 |
| Fax: | 206 938 1307 |
| Website: | www.Traders.com |
| E-mail address: | DPenn@traders.com |
Traders' Resource Links | |
| Charting the Stock Market: The Wyckoff Method -- Books | |
| Working-Money.com -- Online Trading Services | |
| Traders.com Advantage -- Online Trading Services | |
| Technical Analysis of Stocks & Commodities -- Publications and Newsletters | |
| Working Money, at Working-Money.com -- Publications and Newsletters | |
| Traders.com Advantage -- Publications and Newsletters | |
| Professional Traders Starter Kit -- Software | |
Click here for more information about our publications!
PRINT THIS ARTICLE

Request Information From Our Sponsors
- StockCharts.com, Inc.
- Candle Patterns
- Candlestick Charting Explained
- Intermarket Technical Analysis
- John Murphy on Chart Analysis
- John Murphy's Chart Pattern Recognition
- John Murphy's Market Message
- MurphyExplainsMarketAnalysis-Intermarket Analysis
- MurphyExplainsMarketAnalysis-Visual Analysis
- StockCharts.com
- Technical Analysis of the Financial Markets
- The Visual Investor
- VectorVest, Inc.
- Executive Premier Workshop
- One-Day Options Course
- OptionsPro
- Retirement Income Workshop
- Sure-Fire Trading Systems (VectorVest, Inc.)
- Trading as a Business Workshop
- VectorVest 7 EOD
- VectorVest 7 RealTime/IntraDay
- VectorVest AutoTester
- VectorVest Educational Services
- VectorVest OnLine
- VectorVest Options Analyzer
- VectorVest ProGraphics v6.0
- VectorVest ProTrader 7
- VectorVest RealTime Derby Tool
- VectorVest Simulator
- VectorVest Variator
- VectorVest Watchdog
