HOT TOPICS LIST
- MACD
- Fibonacci
- RSI
- Gann
- ADXR
- Stochastics
- Volume
- Triangles
- Futures
- Cycles
- Volatility
- ZIGZAG
- MESA
- Retracement
- Aroon
INDICATORS LIST
LIST OF TOPICS
PRINT THIS ARTICLE
by Gary Grosschadl
IBM is still caught in a trading range, being repelled from $90 once again.
Position: Sell
Gary Grosschadl
Independent Canadian equities trader and technical analyst based in Peterborough
Ontario, Canada.
PRINT THIS ARTICLE
CHART ANALYSIS
IBM's $90 Curse
09/15/03 10:21:45 AMby Gary Grosschadl
IBM is still caught in a trading range, being repelled from $90 once again.
Position: Sell
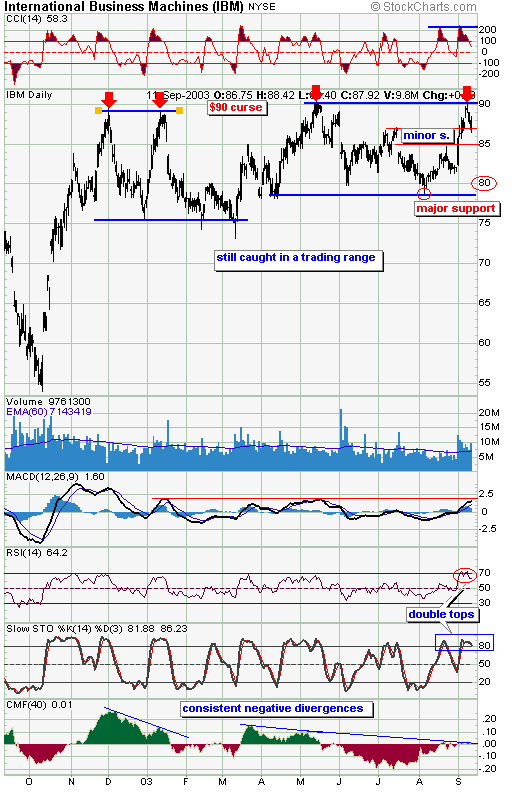
| As this one year daily chart shows, the $90 zone acts as formidable resistance. This latest attempt is the fourth failure in the past year. |
| Stocks in a trading range run from overbought to oversold conditions. This is reflected not only on the chart but also on the CCI (commodity channel index) and stochastics indicators. Both of these are coming off of, not only overbought conditions, but double top type formations. When these occur it often leads to a bigger move down, meaning IBM could move all the way to oversold territory, as opposed to forming a higher bottom. A minor support area is shown on the chart but because of these "double tops" on several indicators, I don't expect the minor support area to hold. |

|
| IBM still in a trading range on this daily chart. |
| Graphic provided by: Stockcharts.com. |
| |
| Another ominous looking indicator is the Chaiken money flow. This supply and demand type indicator (quite different from the momentum indicators) provides a measure of buying and selling pressure. The graph readily shows how the negative divergences have led to sizeable declines. Note how buying pressure is very lacking at this latest top attempt. |
| Should the stock not find support in this $85-87 area, I would expect another test of lower support at $79-80. IBM is still mired in a trading range. |
Independent Canadian equities trader and technical analyst based in Peterborough
Ontario, Canada.
| Website: | www.whatsonsale.ca/financial.html |
| E-mail address: | gwg7@sympatico.ca |
Click here for more information about our publications!
Comments
Date: 09/15/03Rank: 4Comment:

Request Information From Our Sponsors
- StockCharts.com, Inc.
- Candle Patterns
- Candlestick Charting Explained
- Intermarket Technical Analysis
- John Murphy on Chart Analysis
- John Murphy's Chart Pattern Recognition
- John Murphy's Market Message
- MurphyExplainsMarketAnalysis-Intermarket Analysis
- MurphyExplainsMarketAnalysis-Visual Analysis
- StockCharts.com
- Technical Analysis of the Financial Markets
- The Visual Investor
- VectorVest, Inc.
- Executive Premier Workshop
- One-Day Options Course
- OptionsPro
- Retirement Income Workshop
- Sure-Fire Trading Systems (VectorVest, Inc.)
- Trading as a Business Workshop
- VectorVest 7 EOD
- VectorVest 7 RealTime/IntraDay
- VectorVest AutoTester
- VectorVest Educational Services
- VectorVest OnLine
- VectorVest Options Analyzer
- VectorVest ProGraphics v6.0
- VectorVest ProTrader 7
- VectorVest RealTime Derby Tool
- VectorVest Simulator
- VectorVest Variator
- VectorVest Watchdog
