HOT TOPICS LIST
- MACD
- Fibonacci
- RSI
- Gann
- ADXR
- Stochastics
- Volume
- Triangles
- Futures
- Cycles
- Volatility
- ZIGZAG
- MESA
- Retracement
- Aroon
INDICATORS LIST
LIST OF TOPICS
PRINT THIS ARTICLE
by Koos van der Merwe
The put/call ratio is simply the number of put options contracts traded in a given day divided by the number of call options contracts traded that same day. The put volume divided by the call volume yields the put/call ratio.
Position: Buy
Koos van der Merwe
Has been a technical analyst since 1969, and has worked as a futures and options trader with First Financial Futures in Johannesburg, South Africa.
PRINT THIS ARTICLE
PUT/CALL RATIO
Put/Call Ratio On Target
09/12/03 09:34:11 AMby Koos van der Merwe
The put/call ratio is simply the number of put options contracts traded in a given day divided by the number of call options contracts traded that same day. The put volume divided by the call volume yields the put/call ratio.
Position: Buy
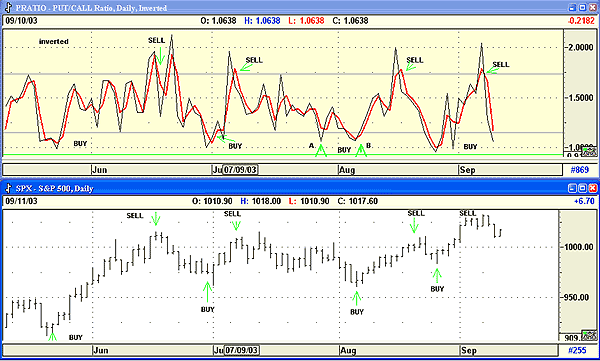
| The chart below shows an inverted put/call ratio and the S&P 500 chart. |
| I have charted the put/call ratio in a thin black line and placed a thicker 2-period simple moving average (SMA) over it in red. Using an SMA will remove some of the volatility from the ratio and in this way give you a better signal. |

|
| The top chart is of an inverted put/call ratio and the bottom chart shows the S&P 500 Index. |
| Graphic provided by: AdvancedGET. |
| |
| The chart signals a buy mode when the moving average of the ratio is below the bottom horizontal band, and a sell when it is above the upper horizontal band. Both bands are chosen by eyeballing the chart and determining the best fit. |
| Note how the ratio gave a buy signal at 'A' whereas the moving average of the ratio (red line) only gave the buy signal at 'B'. The ratio has been pretty accurate over the timespan shown and could be moving into a buy mode in the next few days. |
Has been a technical analyst since 1969, and has worked as a futures and options trader with First Financial Futures in Johannesburg, South Africa.
| Address: | 3256 West 24th Ave |
| Vancouver, BC | |
| Phone # for sales: | 6042634214 |
| E-mail address: | petroosp@gmail.com |
Click here for more information about our publications!
Comments
Date: 09/23/03Rank: 5Comment:
Date: 01/24/04Rank: 5Comment: Where can I get the chart for put/call ratio inverted like that?

Request Information From Our Sponsors
- VectorVest, Inc.
- Executive Premier Workshop
- One-Day Options Course
- OptionsPro
- Retirement Income Workshop
- Sure-Fire Trading Systems (VectorVest, Inc.)
- Trading as a Business Workshop
- VectorVest 7 EOD
- VectorVest 7 RealTime/IntraDay
- VectorVest AutoTester
- VectorVest Educational Services
- VectorVest OnLine
- VectorVest Options Analyzer
- VectorVest ProGraphics v6.0
- VectorVest ProTrader 7
- VectorVest RealTime Derby Tool
- VectorVest Simulator
- VectorVest Variator
- VectorVest Watchdog
- StockCharts.com, Inc.
- Candle Patterns
- Candlestick Charting Explained
- Intermarket Technical Analysis
- John Murphy on Chart Analysis
- John Murphy's Chart Pattern Recognition
- John Murphy's Market Message
- MurphyExplainsMarketAnalysis-Intermarket Analysis
- MurphyExplainsMarketAnalysis-Visual Analysis
- StockCharts.com
- Technical Analysis of the Financial Markets
- The Visual Investor
