HOT TOPICS LIST
- MACD
- Fibonacci
- RSI
- Gann
- ADXR
- Stochastics
- Volume
- Triangles
- Futures
- Cycles
- Volatility
- ZIGZAG
- MESA
- Retracement
- Aroon
INDICATORS LIST
LIST OF TOPICS
PRINT THIS ARTICLE
by Koos van der Merwe
Yes, gold is on the way up, and I believe that it will break above $400 sometime in the future, and yes, it will be a very volatile ride up.
Position: Accumulate
Koos van der Merwe
Has been a technical analyst since 1969, and has worked as a futures and options trader with First Financial Futures in Johannesburg, South Africa.
PRINT THIS ARTICLE
ELLIOTT WAVE
A "GOLD"en Hope
09/12/03 07:55:02 AMby Koos van der Merwe
Yes, gold is on the way up, and I believe that it will break above $400 sometime in the future, and yes, it will be a very volatile ride up.
Position: Accumulate
| The temptation to buy shares in a new mine in some remote part of the world, a bore hole filled with hope, exists in all of us. But then, we are all looking for that "buy' at $0.05 that turns into $50 or more - a good boast at a cocktail party. That is our nature, but how much of a gamble is it? |
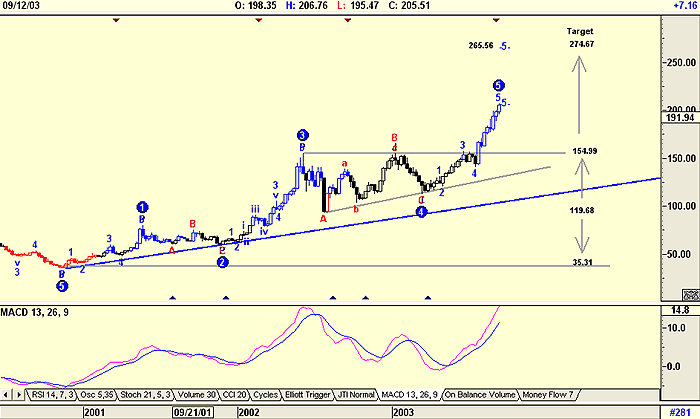
| To answer this question, I look at the Amex Gold Bugs Index. Below is a weekly chart of the Amex Gold Bugs index, prepared with the Advanced GET program. The program has highlighted an Elliott wave count and suggests that the Index is in the process of completing a fifth wave up. The wave count looks perfect and meets the first rule of Elliott, namely that the chart must look right. |

|
| Figure 1: Amex Gold Bugs Index. |
| Graphic provided by: AdvancedGET. |
| |
| The program also suggests an extended fifth wave could occur, with the projection topping at 265.66. This is confirmed with the triangle projection of 274.77 -- close enough to be acceptable. Finally, the MACD indicator shown is still very positive. |
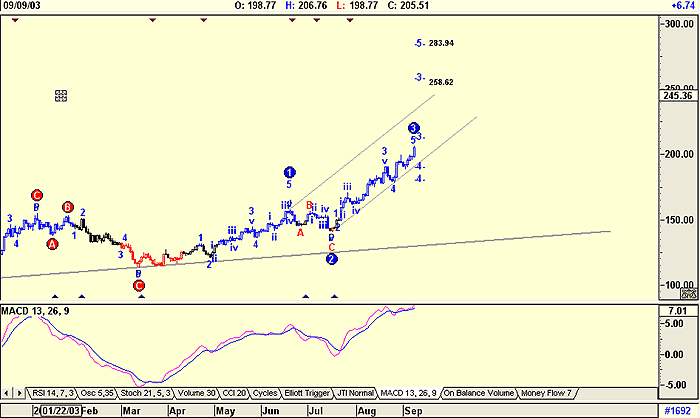
 Figure 2: Daily chart of AMEX Gold Bugs Index. The daily chart gives a slightly different fifth wave count. It suggests that the fifth wave could end at 283.94, but the index must first complete a third wave, and then a fourth wave before attempting the fifth wave challenge. In the daily chart, the standard MACD is also looking overbought, and could signal a fall. |
| That a correction is due appears to be on the cards and should be taken advantage of as another buying opportunity for your favourite gold share. But don't forget, the more that bore hole is filled with hope, the riskier the venture. |
Has been a technical analyst since 1969, and has worked as a futures and options trader with First Financial Futures in Johannesburg, South Africa.
| Address: | 3256 West 24th Ave |
| Vancouver, BC | |
| Phone # for sales: | 6042634214 |
| E-mail address: | petroosp@gmail.com |
Click here for more information about our publications!
Comments
Date: 09/14/03Rank: 2Comment:

|

Request Information From Our Sponsors
- StockCharts.com, Inc.
- Candle Patterns
- Candlestick Charting Explained
- Intermarket Technical Analysis
- John Murphy on Chart Analysis
- John Murphy's Chart Pattern Recognition
- John Murphy's Market Message
- MurphyExplainsMarketAnalysis-Intermarket Analysis
- MurphyExplainsMarketAnalysis-Visual Analysis
- StockCharts.com
- Technical Analysis of the Financial Markets
- The Visual Investor
- VectorVest, Inc.
- Executive Premier Workshop
- One-Day Options Course
- OptionsPro
- Retirement Income Workshop
- Sure-Fire Trading Systems (VectorVest, Inc.)
- Trading as a Business Workshop
- VectorVest 7 EOD
- VectorVest 7 RealTime/IntraDay
- VectorVest AutoTester
- VectorVest Educational Services
- VectorVest OnLine
- VectorVest Options Analyzer
- VectorVest ProGraphics v6.0
- VectorVest ProTrader 7
- VectorVest RealTime Derby Tool
- VectorVest Simulator
- VectorVest Variator
- VectorVest Watchdog
