HOT TOPICS LIST
- MACD
- Fibonacci
- RSI
- Gann
- ADXR
- Stochastics
- Volume
- Triangles
- Futures
- Cycles
- Volatility
- ZIGZAG
- MESA
- Retracement
- Aroon
INDICATORS LIST
LIST OF TOPICS
PRINT THIS ARTICLE
by Kevin Hopson
Brigham Exploration has broken out of an eight-month bullish triangle formation, indicating higher prices ahead.
Position: Accumulate
Kevin Hopson
Kevin has been a technical analyst for roughly 10 years now. Previously, Kevin owned his own business and acted as a registered investment advisor, specializing in energy. He was also a freelance oil analyst for Orient Trading Co., a commodity futures trading firm in Japan. Kevin is currently a freelance writer.
PRINT THIS ARTICLE
TRIANGLES
Brigham Exploration's Triangle Breakout
09/09/03 09:58:58 AMby Kevin Hopson
Brigham Exploration has broken out of an eight-month bullish triangle formation, indicating higher prices ahead.
Position: Accumulate
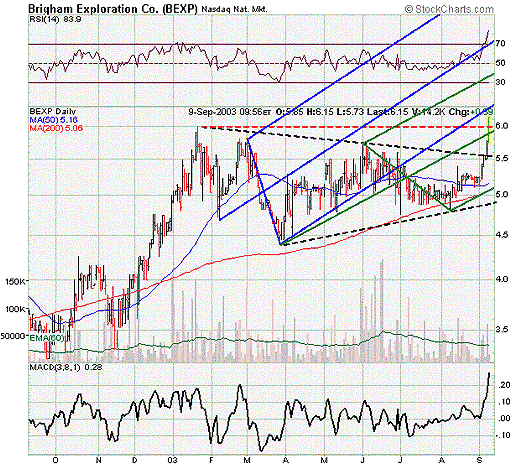
| Brigham Exploration (BEXP) has been consolidating for nearly eight months after breaking out to a new 52-week high this past January. More specifically, you will notice that the stock was forming a large triangle - a pattern of lower highs and higher lows - up until last week. Since symmetrical triangles tend to be continuation patterns and the long-term trend was up, a break to the upside was a good probability. As you can see, Brigham has now broken to the upside from the bullish triangle formation, thus confirming this theory. |
| So how high will the stock go now that the breakout has taken place? If you take the base of the triangle, or subtract the bottom trendline ($4.40) from the top trendline ($6.00), you come up with $1.60. When you add this number to the initial breakout point ($5.50), the approximate price target is $7.00 and change. As a result, Brigham looks to have additional upside potential in the short-term. |

|
| Graphic provided by: Stockcharts.com. |
| |
| Though the bottom blue parallel line may cap prices in the near-term, this trendline should only act as temporary resistance. Additionally, if the stock price proceeds to pull back, the $5.90 to $6.00 range - site of the stock's prior 52-week high (dotted red line) and the green median line - should act as significant support. As a result, I would look to accumulate shares of Brigham Exploration on a pullback to this price range. |
Kevin has been a technical analyst for roughly 10 years now. Previously, Kevin owned his own business and acted as a registered investment advisor, specializing in energy. He was also a freelance oil analyst for Orient Trading Co., a commodity futures trading firm in Japan. Kevin is currently a freelance writer.
| Glen Allen, VA | |
| E-mail address: | hopson_1@yahoo.com |
Click here for more information about our publications!
Comments
Date: 09/21/03Rank: 2Comment:

Request Information From Our Sponsors
- StockCharts.com, Inc.
- Candle Patterns
- Candlestick Charting Explained
- Intermarket Technical Analysis
- John Murphy on Chart Analysis
- John Murphy's Chart Pattern Recognition
- John Murphy's Market Message
- MurphyExplainsMarketAnalysis-Intermarket Analysis
- MurphyExplainsMarketAnalysis-Visual Analysis
- StockCharts.com
- Technical Analysis of the Financial Markets
- The Visual Investor
- VectorVest, Inc.
- Executive Premier Workshop
- One-Day Options Course
- OptionsPro
- Retirement Income Workshop
- Sure-Fire Trading Systems (VectorVest, Inc.)
- Trading as a Business Workshop
- VectorVest 7 EOD
- VectorVest 7 RealTime/IntraDay
- VectorVest AutoTester
- VectorVest Educational Services
- VectorVest OnLine
- VectorVest Options Analyzer
- VectorVest ProGraphics v6.0
- VectorVest ProTrader 7
- VectorVest RealTime Derby Tool
- VectorVest Simulator
- VectorVest Variator
- VectorVest Watchdog
