HOT TOPICS LIST
- MACD
- Fibonacci
- RSI
- Gann
- ADXR
- Stochastics
- Volume
- Triangles
- Futures
- Cycles
- Volatility
- ZIGZAG
- MESA
- Retracement
- Aroon
INDICATORS LIST
LIST OF TOPICS
PRINT THIS ARTICLE
by Gary Grosschadl
The weekly chart shows this stock at a key level with upside implications.
Position: Hold
Gary Grosschadl
Independent Canadian equities trader and technical analyst based in Peterborough
Ontario, Canada.
PRINT THIS ARTICLE
DOUBLE BOTTOMS
Andrew Corporation Working On A Double Bottom
09/09/03 10:48:45 AMby Gary Grosschadl
The weekly chart shows this stock at a key level with upside implications.
Position: Hold
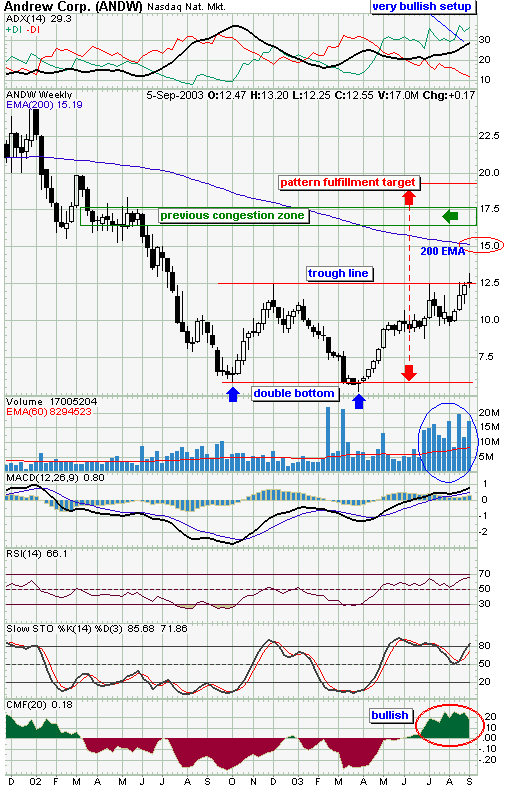
| Symmetry wise and timewise Andrew Corp. looks to be forming a double bottom. Early bird traders who ventured in at the second bottom hoping for a double bottom type bounce have been well rewarded. The double bottom formation really comes into play once the stock breaks the trough line to the upside. Until it does so, the move off bottom is a double bottom gamble or attempt. The stock now finds itself at this crucial point right at the trough line. |
| Volume has been on the upswing the past ten weeks as traders have likely been anticipating this move to the trough line. Ideally, high volume will push the stock's price through this barrier. If this occurs there are several upside targets to consider. |

|
| Weekly chart of Andrew Corp. |
| Graphic provided by: Stockcharts.com. |
| |
| A bullish break that fulfills the double bottom pattern to ideal completion has a bold upside target of $19. This measurement is taken from the double bottom to the trough line and then applied to the upside from the same trough line. However there are a couple of likely key resistance areas to challenge before that ambitious target is reached. The 200-period EMA is often a strong area of support or resistance on any chart. The current value of this moving average is $15.19. Should the bulls manage to take the stock past this level, then major resistance can also be expected at the previous congestion level as marked in green. |
| Several indicators are also showing a bullish bias. The directional movement indicator at the top of the chart shows a strong trend with the ADX line at a strong level and upsloping between the bullishly positioned DI lines. The MACD lines (moving average convergence/divergence) have both moved above the zero line, this being a bullish development. The stochastics oscillator and the RSI (relative strength index) are both showing bullish form. The Chaiken money flow indicator (CMF) which is a measure of supply and demand pressure, also shows a recent bullish upswing. |
| On the cautionary side, the last candlestick was a doji (same open and close) which can be a warning of a top or loss of momentum. This needs confirmation. In this case, a move above the doji negates the warning. The stock is a hold for now until the outcome of this current test at the trough line. A high volume break to the upside makes for a good short-term buy signal. A move to the downside with similar volume conviction would call for a sell signal for short-term traders. Longer term traders may decide to see how a possible $10 support level is handled. |
Independent Canadian equities trader and technical analyst based in Peterborough
Ontario, Canada.
| Website: | www.whatsonsale.ca/financial.html |
| E-mail address: | gwg7@sympatico.ca |
Click here for more information about our publications!
Comments
Date: 09/14/03Rank: 5Comment:

Request Information From Our Sponsors
- VectorVest, Inc.
- Executive Premier Workshop
- One-Day Options Course
- OptionsPro
- Retirement Income Workshop
- Sure-Fire Trading Systems (VectorVest, Inc.)
- Trading as a Business Workshop
- VectorVest 7 EOD
- VectorVest 7 RealTime/IntraDay
- VectorVest AutoTester
- VectorVest Educational Services
- VectorVest OnLine
- VectorVest Options Analyzer
- VectorVest ProGraphics v6.0
- VectorVest ProTrader 7
- VectorVest RealTime Derby Tool
- VectorVest Simulator
- VectorVest Variator
- VectorVest Watchdog
- StockCharts.com, Inc.
- Candle Patterns
- Candlestick Charting Explained
- Intermarket Technical Analysis
- John Murphy on Chart Analysis
- John Murphy's Chart Pattern Recognition
- John Murphy's Market Message
- MurphyExplainsMarketAnalysis-Intermarket Analysis
- MurphyExplainsMarketAnalysis-Visual Analysis
- StockCharts.com
- Technical Analysis of the Financial Markets
- The Visual Investor
