HOT TOPICS LIST
- MACD
- Fibonacci
- RSI
- Gann
- ADXR
- Stochastics
- Volume
- Triangles
- Futures
- Cycles
- Volatility
- ZIGZAG
- MESA
- Retracement
- Aroon
INDICATORS LIST
LIST OF TOPICS
PRINT THIS ARTICLE
by Gary Grosschadl
Mediacom Communications breaks out of a low trading range but what comes next?
Position: Hold
Gary Grosschadl
Independent Canadian equities trader and technical analyst based in Peterborough
Ontario, Canada.
PRINT THIS ARTICLE
CHART ANALYSIS
Mediacom Moves Off Bottom
09/09/03 10:31:17 AMby Gary Grosschadl
Mediacom Communications breaks out of a low trading range but what comes next?
Position: Hold
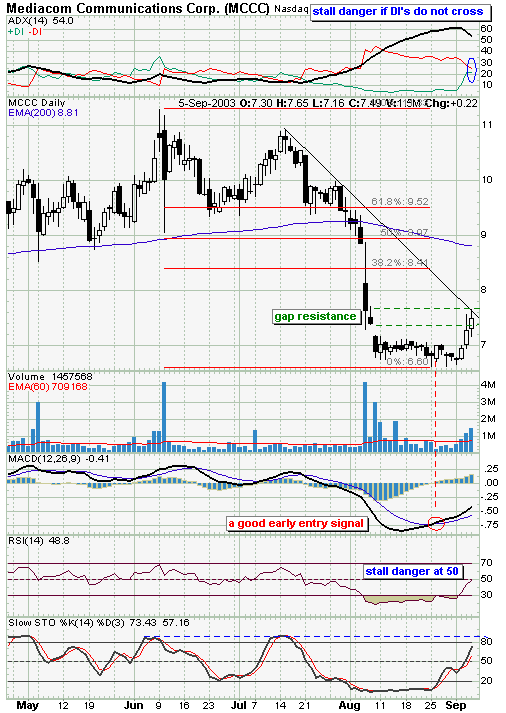
| This daily chart shows how MCCC suffered when it fell through its 200-day EMA in early August. With a series of gaps it plummeted from above $9 to below $7. After meandering sideways for several weeks, it has finally made a move off this bottom range. Note how the bullish cross from the MACD indicator (moving average convergence/divergence) gave a good heads up to a coming bullish upswing. |
| After a three day upswing does it have more upside or is a consolidation in order? The current picture shows some mixed signals but I am leaning to the consolidation scenario for several reasons. Short-term moves are often limited to a two or three day pop when the gains become ripe for profit taking. Chartwise, the stock has risen to trendline resistance and to gap resistance, this being the top of the second gap as marked by the higher dotted green line. This increases the odds for some type of retracement or consolidation. |

|
| MCCC's daily chart at gap and trendline resistance. |
| Graphic provided by: Stockcharts.com. |
| |
| Two indicators also are at potential stall levels. The directional movement indicator (top of chart) shows the DIs have bullishly converged but have not crossed. Often stalls occur when these lines refuse to cross. The best short-term moves often come as the DIs rapidly converge just short of an actual crossover, especially when the stock has already made a sizeable move as is the case here. A similar situation is found looking at the RSI (relative strength indicator). This indicator is at the 50 level. This 50 level is often the make or break line. Moves through this level in either direction are often noteworthy provided that this is not a stall point. Stocks that hesitate at this level often run out of gas and after a three day run I am a little suspicious of this mark. |
| On the plus side it is noted that a bearish candlestick has not yet formed and the stochastics indicator shows some possible bullish upside room so it would be prudent here to wait for some signs of confirmation either way. A move and close past Friday's high could be a sign of the bulls advancing this stock to the next probable upside targets. Two levels to watch in this case are the 38.2% Fibonacci level of 8.41 and the 200-day EMA of 8.81. |
| Monday's closing candlestick will very likely supply short-term traders with a tradeable signal. I am leaning towards a retracement scenario that could return the stock to the $7 area but the market should soon tip its hand to what is actually in store. |
Independent Canadian equities trader and technical analyst based in Peterborough
Ontario, Canada.
| Website: | www.whatsonsale.ca/financial.html |
| E-mail address: | gwg7@sympatico.ca |
Click here for more information about our publications!
Comments
Date: 09/27/03Rank: 4Comment:

Request Information From Our Sponsors
- StockCharts.com, Inc.
- Candle Patterns
- Candlestick Charting Explained
- Intermarket Technical Analysis
- John Murphy on Chart Analysis
- John Murphy's Chart Pattern Recognition
- John Murphy's Market Message
- MurphyExplainsMarketAnalysis-Intermarket Analysis
- MurphyExplainsMarketAnalysis-Visual Analysis
- StockCharts.com
- Technical Analysis of the Financial Markets
- The Visual Investor
- VectorVest, Inc.
- Executive Premier Workshop
- One-Day Options Course
- OptionsPro
- Retirement Income Workshop
- Sure-Fire Trading Systems (VectorVest, Inc.)
- Trading as a Business Workshop
- VectorVest 7 EOD
- VectorVest 7 RealTime/IntraDay
- VectorVest AutoTester
- VectorVest Educational Services
- VectorVest OnLine
- VectorVest Options Analyzer
- VectorVest ProGraphics v6.0
- VectorVest ProTrader 7
- VectorVest RealTime Derby Tool
- VectorVest Simulator
- VectorVest Variator
- VectorVest Watchdog
