HOT TOPICS LIST
- MACD
- Fibonacci
- RSI
- Gann
- ADXR
- Stochastics
- Volume
- Triangles
- Futures
- Cycles
- Volatility
- ZIGZAG
- MESA
- Retracement
- Aroon
INDICATORS LIST
LIST OF TOPICS
PRINT THIS ARTICLE
by Kevin Hopson
Devon Energy looks to be forming a bullish triangle but the stock has little margin for error if higher prices are going to prevail.
Position: Hold
Kevin Hopson
Kevin has been a technical analyst for roughly 10 years now. Previously, Kevin owned his own business and acted as a registered investment advisor, specializing in energy. He was also a freelance oil analyst for Orient Trading Co., a commodity futures trading firm in Japan. Kevin is currently a freelance writer.
PRINT THIS ARTICLE
TECHNICAL ANALYSIS
What Will Devon Energy Do Next?
09/08/03 07:51:56 AMby Kevin Hopson
Devon Energy looks to be forming a bullish triangle but the stock has little margin for error if higher prices are going to prevail.
Position: Hold
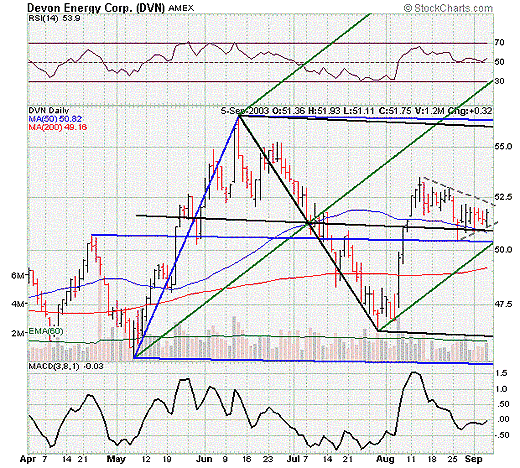
| Devon Energy (DVN) has recovered nicely the past few weeks after dropping roughly 18 percent from mid-June to late July. Though Devon's recent advance was halted around the $53.50 level, the stock looks to be forming a large bullish triangle. This is illustrated by the dotted gray lines in the six-month chart. Since Devon is planning to provide an operational update on Tuesday, September 9, there is a potential catalyst for higher prices in the near future. |
| However, it will be important to see what develops in the coming days. For example, notice how there is a significant confluence of support in the $50.50 to $51.00 range. More specifically, the black and blue median lines, the stock's 50-day moving average and July's uptrend line (bottom green parallel line) are all converging in this area. In other words, a break of key support here would all but shatter the chances of a move higher. |

|
| Graphic provided by: Stockcharts.com. |
| |
| Unfortunately, there is another twist to the story. Since Devon failed to test the green median line during August's run-up, a test of July's uptrend line in the near-term would indicate weakness. This behavior, also known as the "price failure" rule in pitchfork analysis, often results in a break of the bottom parallel line (uptrend line). As a result, it is important that Devon hold above the black median line and its 50-day moving average despite further support at lower levels. |
| If Devon is successful in doing this and can eventually overcome August's downtrend line around the $52.00 level, the stock should see a nice move to the upside. Otherwise, a break of support just below $51.00 will likely lead to a further pullback to the $49.00 level, site of the stock's 200-day moving average and the 61.8 percent retracement level from the July-August rally. |
Kevin has been a technical analyst for roughly 10 years now. Previously, Kevin owned his own business and acted as a registered investment advisor, specializing in energy. He was also a freelance oil analyst for Orient Trading Co., a commodity futures trading firm in Japan. Kevin is currently a freelance writer.
| Glen Allen, VA | |
| E-mail address: | hopson_1@yahoo.com |
Click here for more information about our publications!
PRINT THIS ARTICLE

Request Information From Our Sponsors
- VectorVest, Inc.
- Executive Premier Workshop
- One-Day Options Course
- OptionsPro
- Retirement Income Workshop
- Sure-Fire Trading Systems (VectorVest, Inc.)
- Trading as a Business Workshop
- VectorVest 7 EOD
- VectorVest 7 RealTime/IntraDay
- VectorVest AutoTester
- VectorVest Educational Services
- VectorVest OnLine
- VectorVest Options Analyzer
- VectorVest ProGraphics v6.0
- VectorVest ProTrader 7
- VectorVest RealTime Derby Tool
- VectorVest Simulator
- VectorVest Variator
- VectorVest Watchdog
- StockCharts.com, Inc.
- Candle Patterns
- Candlestick Charting Explained
- Intermarket Technical Analysis
- John Murphy on Chart Analysis
- John Murphy's Chart Pattern Recognition
- John Murphy's Market Message
- MurphyExplainsMarketAnalysis-Intermarket Analysis
- MurphyExplainsMarketAnalysis-Visual Analysis
- StockCharts.com
- Technical Analysis of the Financial Markets
- The Visual Investor
