HOT TOPICS LIST
- MACD
- Fibonacci
- RSI
- Gann
- ADXR
- Stochastics
- Volume
- Triangles
- Futures
- Cycles
- Volatility
- ZIGZAG
- MESA
- Retracement
- Aroon
INDICATORS LIST
LIST OF TOPICS
PRINT THIS ARTICLE
by Andrew Hetherington
In my previous article at the end of February I suggested that the small head and shoulders top pattern would have a pullback into the $17.00 area and then drop to the buy long position of $14.00. This short was profitable at that time and I prognosticated big things to come from this much larger bottom reversal head and shoulders pattern that was looming.
Position: N/A
Andrew Hetherington
Classic Dow Theorist who trades as a pure technician, using pattern recognition.
PRINT THIS ARTICLE
CHART ANALYSIS
Hewlett Has Been Revving Up
09/08/03 01:04:14 PMby Andrew Hetherington
In my previous article at the end of February I suggested that the small head and shoulders top pattern would have a pullback into the $17.00 area and then drop to the buy long position of $14.00. This short was profitable at that time and I prognosticated big things to come from this much larger bottom reversal head and shoulders pattern that was looming.
Position: N/A
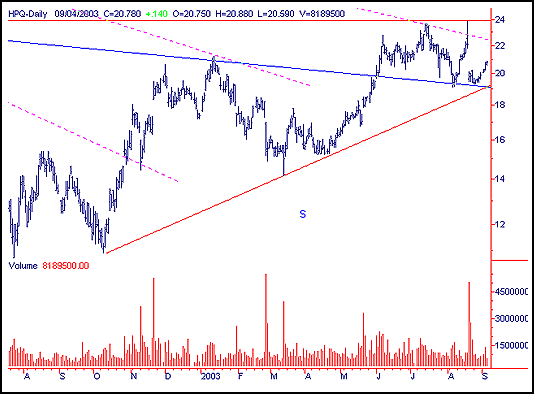
 Figure 1: Daily chart of Hewlett Packard. As always, it is patterns within patterns. Although the much larger pattern was incomplete, I anticipated this reversal so traders could try and catch that ever elusive bottom. We hear time and again how it is impossible to catch the bottom of the next bull market and this was an opportunity for medium and long-term investors to take a leap of faith on the chart during unsettled economic times. These bottoms don't happen often and if timed correctly you place yourself in a protected position and can ride out the normal ups and downs on a daily and weekly basis and stay for the entire ride upwards. Catching the bottom of the right shoulder is a gamble that can be worthwhile -- however, it's not for the weak of heart. |

|
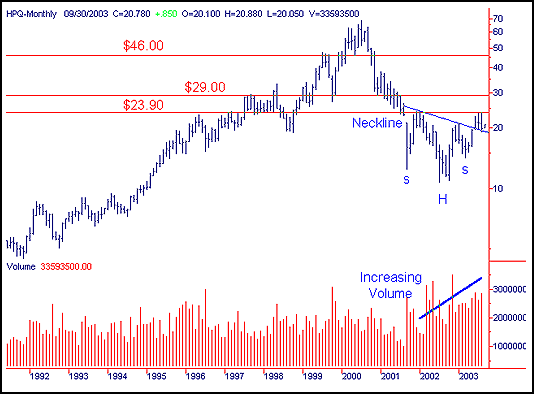
| Figure 2: Monthly chart of Hewlett Packard. |
| Graphic provided by: SuperCharts. |
| |
| The monthly chart clearly shows the accumulation of increasing volumes from left to right. |
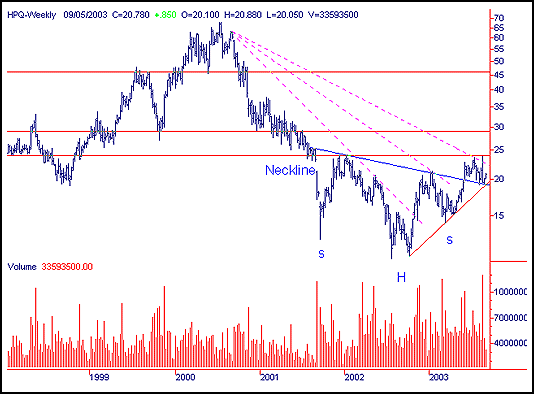
 Figure 3: Weekly chart of Hewlett Packard. The weekly chart shows the breakout at the end of May and the beginning of June. The volume increased as required on this breakout. There is the usual throwback to the neckline in the $19.00 area after the breakout and there is only one direction for this equity to leap. The third fan line on the long-term charts will break in the $22.50 area and I anticipate another round of increased activity when this occurs. I've adjusted my third fan line, which can be seen as the red trendline from the base of the head, up towards the bottom of the right shoulder. This performance line should hold for some time and gives the savvy investor a signal of when to reinvest if they had sold earlier long positions. If looking to take a new long position, Hewlett Packard is currently in the cradle and this is a fairly safe buying opportunity. |
Classic Dow Theorist who trades as a pure technician, using pattern recognition.
| Toronto, Canada |
Click here for more information about our publications!
PRINT THIS ARTICLE

|

Request Information From Our Sponsors
- StockCharts.com, Inc.
- Candle Patterns
- Candlestick Charting Explained
- Intermarket Technical Analysis
- John Murphy on Chart Analysis
- John Murphy's Chart Pattern Recognition
- John Murphy's Market Message
- MurphyExplainsMarketAnalysis-Intermarket Analysis
- MurphyExplainsMarketAnalysis-Visual Analysis
- StockCharts.com
- Technical Analysis of the Financial Markets
- The Visual Investor
- VectorVest, Inc.
- Executive Premier Workshop
- One-Day Options Course
- OptionsPro
- Retirement Income Workshop
- Sure-Fire Trading Systems (VectorVest, Inc.)
- Trading as a Business Workshop
- VectorVest 7 EOD
- VectorVest 7 RealTime/IntraDay
- VectorVest AutoTester
- VectorVest Educational Services
- VectorVest OnLine
- VectorVest Options Analyzer
- VectorVest ProGraphics v6.0
- VectorVest ProTrader 7
- VectorVest RealTime Derby Tool
- VectorVest Simulator
- VectorVest Variator
- VectorVest Watchdog
