HOT TOPICS LIST
- MACD
- Fibonacci
- RSI
- Gann
- ADXR
- Stochastics
- Volume
- Triangles
- Futures
- Cycles
- Volatility
- ZIGZAG
- MESA
- Retracement
- Aroon
INDICATORS LIST
LIST OF TOPICS
PRINT THIS ARTICLE
by David Penn
A negative divergence sets up a sharply downward turn in crude oil futures.
Position: N/A
David Penn
Technical Writer for Technical Analysis of STOCKS & COMMODITIES magazine, Working-Money.com, and Traders.com Advantage.
PRINT THIS ARTICLE
REVERSAL
Crude Oil Finally Cracks
09/09/03 10:34:13 AMby David Penn
A negative divergence sets up a sharply downward turn in crude oil futures.
Position: N/A
| As someone who has been bearish on crude oil since early July (ouch!), I won't even pretend not to have given a cheer as crude oil futures fell sharply in early September. Writing back on July 8th, I pointed to a 2B test of top that had developed on the price chart of September crude oil futures and suggested that a break beneath a two and a half uptrend line "could add to the bearish signals." (see my article "September Crude's 2B Test of Top," Traders.com Advantage, July 8, 2003). |
| That trendline break did not come. And crude oil, which had been testing the $30 level in June and early July, managed to break out above this resistance and continue higher. Basis September, crude oil climbed above 31 by mid-July and breached 32 by mid-August. |

|
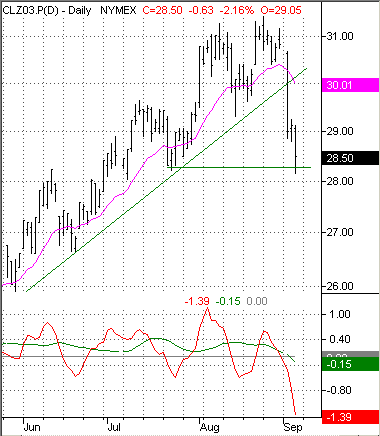
| Oversold after this severe break, a bounce could set up a head and shoulders top in December crude oil futures. |
| Graphic provided by: TradeStation. |
| |
| But the turn in crude oil now seems positively at hand. The clearest indication that a trend reversal might be near was a classic negative divergence between the indicator and price action. The indicator used here is one developed by Market Wizard, Linda Bradford Raschke, whom I increasingly feel compelled to refer to as the "Queen of Swing" for her fascinating swing trading methodologies. The indicator, which she refers to as the "3-10 oscillator," is discussed in her book Street Smarts (co-authored with another swing-trading expert, Lawrence Connors). Put simply, the oscillator which is part of the 'ANTI' swing-trading setup revealed in Street Smarts -- is a "3-10 moving average oscillator with a simple 16-period moving average of itself." She notes that the stochastic indicator can be "tinkered" into mirroring the effect of the 3-10 oscillator by using a 7%K and a 10%D. |
| In any event, compare the highs in price action in crude oil (now looking at the December contract) in early August and late August. December crude made a contract high of 31.30 on August 8th, retraced to just above 29, and then scored an even higher high of 31.45 on August 25th. However, at the same time, the 3-10 oscillator was registering a higher high on the 8th of August compared to the 25th of August. This development was a classic example of a negative divergence, and should have put traders on alert that crude oil was vulnerable to a reversal. |
| The reversal came swiftly, as December crude oil futures broke down, falling from 31.45 to 28.85 in about five days. As of this writing, the futures have fallen to just above 28 -- and here is where traders may want to take caution. There is support for crude oil at these levels -- support created by the decline in late July which left a swing low at 28.20. Given this -- and the sharpness of the correction so far -- it is quite possible that crude oil will find support at these levels and bounce. While it is true that such a bounce could set up a more formal top in the way of a head and shoulders pattern, such a development may be well worth waiting out. A breakdown beneath 28, given the heights reached in August, could easily send December crude oil futures to as low as 25 in an initial move down. |
Technical Writer for Technical Analysis of STOCKS & COMMODITIES magazine, Working-Money.com, and Traders.com Advantage.
| Title: | Technical Writer |
| Company: | Technical Analysis, Inc. |
| Address: | 4757 California Avenue SW |
| Seattle, WA 98116 | |
| Phone # for sales: | 206 938 0570 |
| Fax: | 206 938 1307 |
| Website: | www.Traders.com |
| E-mail address: | DPenn@traders.com |
Traders' Resource Links | |
| Charting the Stock Market: The Wyckoff Method -- Books | |
| Working-Money.com -- Online Trading Services | |
| Traders.com Advantage -- Online Trading Services | |
| Technical Analysis of Stocks & Commodities -- Publications and Newsletters | |
| Working Money, at Working-Money.com -- Publications and Newsletters | |
| Traders.com Advantage -- Publications and Newsletters | |
| Professional Traders Starter Kit -- Software | |
Click here for more information about our publications!
Comments
Date: 09/10/03Rank: 5Comment: Thank you mr. Penn, your Article are always interesting and supportive

|

Request Information From Our Sponsors
- StockCharts.com, Inc.
- Candle Patterns
- Candlestick Charting Explained
- Intermarket Technical Analysis
- John Murphy on Chart Analysis
- John Murphy's Chart Pattern Recognition
- John Murphy's Market Message
- MurphyExplainsMarketAnalysis-Intermarket Analysis
- MurphyExplainsMarketAnalysis-Visual Analysis
- StockCharts.com
- Technical Analysis of the Financial Markets
- The Visual Investor
- VectorVest, Inc.
- Executive Premier Workshop
- One-Day Options Course
- OptionsPro
- Retirement Income Workshop
- Sure-Fire Trading Systems (VectorVest, Inc.)
- Trading as a Business Workshop
- VectorVest 7 EOD
- VectorVest 7 RealTime/IntraDay
- VectorVest AutoTester
- VectorVest Educational Services
- VectorVest OnLine
- VectorVest Options Analyzer
- VectorVest ProGraphics v6.0
- VectorVest ProTrader 7
- VectorVest RealTime Derby Tool
- VectorVest Simulator
- VectorVest Variator
- VectorVest Watchdog
