HOT TOPICS LIST
- MACD
- Fibonacci
- RSI
- Gann
- ADXR
- Stochastics
- Volume
- Triangles
- Futures
- Cycles
- Volatility
- ZIGZAG
- MESA
- Retracement
- Aroon
INDICATORS LIST
LIST OF TOPICS
PRINT THIS ARTICLE
by Matt Blackman
August was a period of consolidation for the market. Two patterns were in the process of forming, one bullish and one bearish. Score one for the bulls!
Position: Buy
Matt Blackman
Matt Blackman is a full-time technical and financial writer and trader. He produces corporate and financial newsletters, and assists clients in getting published in the mainstream media. He is the host of TradeSystemGuru.com. Matt has earned the Chartered Market Technician (CMT) designation. Find out what stocks and futures Matt is watching on Twitter at www.twitter.com/RatioTrade
PRINT THIS ARTICLE
FLAGS AND PENNANTS
Break Out The Cigars - It's A Flag!
09/05/03 11:40:46 AMby Matt Blackman
August was a period of consolidation for the market. Two patterns were in the process of forming, one bullish and one bearish. Score one for the bulls!
Position: Buy
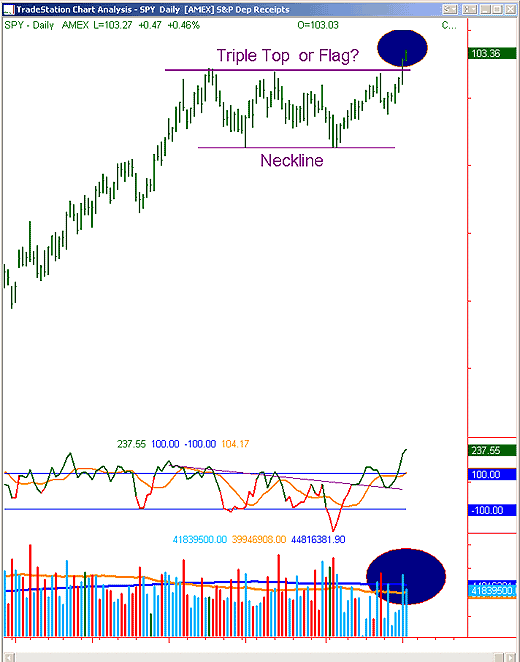
| In my August 28th article, "Triple Top or Flag?", I showed two potential patterns that were forming on the Standard & Poor's Deposits/Receipts (SPY). It would take a breakout to confirm the winner. Would it be the bearish triple top or bullish flag? A breakout has occurred and the good news is that it's the flag! Historically, the day after Labor Day enjoys the largest post-season one-day gain of any holiday and it didn't let us down this year. Both the DOW and the SPY enjoyed a better than 1.1% gain. The breakout was confirmed on September 3rd as both continued to move higher. A chart pattern breakout is said to be fully confirmed once the price has moved a minimum 3% above the resistance level, is retested and the old resistance forms support. This would put the DOW at roughly 9700, the S&P 500 at 1047 and the SPY above 105. |
| A breakout is also more convincing if it occurs on high volume. This confirms that buyers have come into market with a vengeance. While September volumes have been above August averages, next week will be the teller as the vast majority of big market players will be back at work. Traders with longer-term time horizons will continue to watch longer-term bond yields and commodity prices for signs of a continued rise in interest rates. A rise in commodities is an early harbinger of higher inflationary pressures. Higher inflation leads to higher rates. Low rates and a slow economy have been at least partially responsible for record levels of overall debt and any increase in interest rates (increasing bond yields) will have an exaggerated chilling effect on corporations that are heavily indebted, not to mention home buyers and the beleaguered consumer. |

|
| Figure 1 – Daily chart of the Standard & Poor’s Deposits/Receipts (SPY) showing breakout about horizontal flag top line. A continued move higher on increasing volume followed by a retest of the new support level at 102 would add further credence to the move. |
| Graphic provided by: TradeStation. |
| |
Matt Blackman is a full-time technical and financial writer and trader. He produces corporate and financial newsletters, and assists clients in getting published in the mainstream media. He is the host of TradeSystemGuru.com. Matt has earned the Chartered Market Technician (CMT) designation. Find out what stocks and futures Matt is watching on Twitter at www.twitter.com/RatioTrade
| Company: | TradeSystemGuru.com |
| Address: | Box 2589 |
| Garibaldi Highlands, BC Canada | |
| Phone # for sales: | 604-898-9069 |
| Fax: | 604-898-9069 |
| Website: | www.tradesystemguru.com |
| E-mail address: | indextradermb@gmail.com |
Traders' Resource Links | |
| TradeSystemGuru.com has not added any product or service information to TRADERS' RESOURCE. | |
Click here for more information about our publications!
Comments
Date: 09/09/03Rank: 4Comment:
Date: 09/14/03Rank: 5Comment:
Date: 09/21/03Rank: 4Comment:

Request Information From Our Sponsors
- StockCharts.com, Inc.
- Candle Patterns
- Candlestick Charting Explained
- Intermarket Technical Analysis
- John Murphy on Chart Analysis
- John Murphy's Chart Pattern Recognition
- John Murphy's Market Message
- MurphyExplainsMarketAnalysis-Intermarket Analysis
- MurphyExplainsMarketAnalysis-Visual Analysis
- StockCharts.com
- Technical Analysis of the Financial Markets
- The Visual Investor
- VectorVest, Inc.
- Executive Premier Workshop
- One-Day Options Course
- OptionsPro
- Retirement Income Workshop
- Sure-Fire Trading Systems (VectorVest, Inc.)
- Trading as a Business Workshop
- VectorVest 7 EOD
- VectorVest 7 RealTime/IntraDay
- VectorVest AutoTester
- VectorVest Educational Services
- VectorVest OnLine
- VectorVest Options Analyzer
- VectorVest ProGraphics v6.0
- VectorVest ProTrader 7
- VectorVest RealTime Derby Tool
- VectorVest Simulator
- VectorVest Variator
- VectorVest Watchdog
