HOT TOPICS LIST
- MACD
- Fibonacci
- RSI
- Gann
- ADXR
- Stochastics
- Volume
- Triangles
- Futures
- Cycles
- Volatility
- ZIGZAG
- MESA
- Retracement
- Aroon
INDICATORS LIST
LIST OF TOPICS
PRINT THIS ARTICLE
by Gary Grosschadl
The world's second largest nickel producer is at a crucial point in its chart formation.
Position: Hold
Gary Grosschadl
Independent Canadian equities trader and technical analyst based in Peterborough
Ontario, Canada.
PRINT THIS ARTICLE
CHART ANALYSIS
Canadian Nickel Giant, Inco Ltd. At A Crossroads
09/05/03 10:00:26 AMby Gary Grosschadl
The world's second largest nickel producer is at a crucial point in its chart formation.
Position: Hold
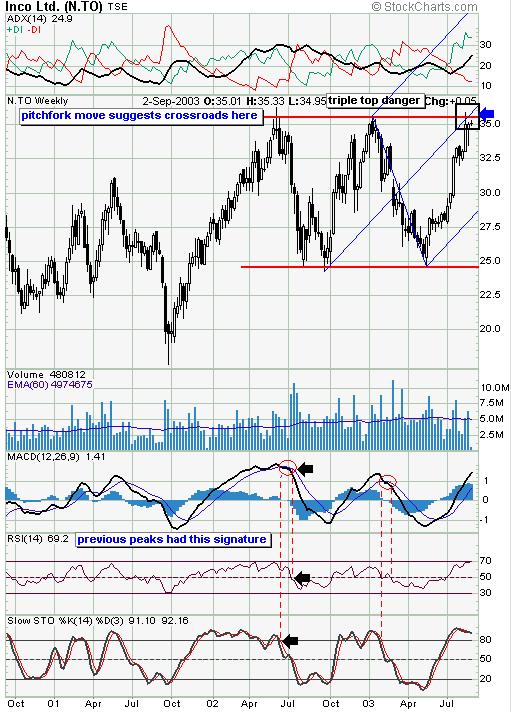
| Nickel prices have been going up this year, so nickel plays have done well. However Inco Ltd.'s weekly chart shows the danger, or opportunity, for this nickel giant. This crossroad takes the form of a possible triple top danger or a bullish thrust beyond this formation. |
| The symmetry is unmistakably good for a potential triple top as this chart shows. The declining volume at this third "top" also is suggestive of buyers' weakening bullish conviction. |

|
| Graphic provided by: Stockcharts.com. |
| |
| A pitchfork has been drawn to show that another important point may be in the works. Using the last three significant turning points on the chart as pivots for placing the pitchfork (or Andrews Line), we see an important feature. One of the mainstays of pitchfork theory holds that a move off either upper or lower fork will often reach the median line (middle fork). This is often major resistance so it translates to a move back down or a very bullish thrust beyond. So in this case the median line of the pitchfork is being tested in the same area as the potential triple top. The next move could be significant -- but which way will it break? |
| To gain further insight, I've examined several indicators. The directional movement indicator at the top of the chart is a trend strength indicator with the trend strength component being the ADX line. The ideal situation is to have the ADX line above 20-25 and upsloping with the DI components on either side, as illustrated. With a current ADX value of 24.9, this indicator remains bullish. The three momentum-based oscillators below the chart show that a significant danger point has not quite been reached in comparison to previous tops but overbought conditions do exist. So if history repeats itself and the indicators give the same signals as they did on the previous tops, then look for the MACD (moving average convergence/divergence) to show a bearish crossover, the RSI (relative strength indicator) to decline below 50, and the stochastics oscillator to decline below 80. |
| In summary this stock is a hold until the next move becomes clearer, the next move likely being a significant one with opportunities to go long, sell or go short. Watch for a sustainable move on large volume with valuable clues from the indicators discussed. |
Independent Canadian equities trader and technical analyst based in Peterborough
Ontario, Canada.
| Website: | www.whatsonsale.ca/financial.html |
| E-mail address: | gwg7@sympatico.ca |
Click here for more information about our publications!
PRINT THIS ARTICLE

Request Information From Our Sponsors
- VectorVest, Inc.
- Executive Premier Workshop
- One-Day Options Course
- OptionsPro
- Retirement Income Workshop
- Sure-Fire Trading Systems (VectorVest, Inc.)
- Trading as a Business Workshop
- VectorVest 7 EOD
- VectorVest 7 RealTime/IntraDay
- VectorVest AutoTester
- VectorVest Educational Services
- VectorVest OnLine
- VectorVest Options Analyzer
- VectorVest ProGraphics v6.0
- VectorVest ProTrader 7
- VectorVest RealTime Derby Tool
- VectorVest Simulator
- VectorVest Variator
- VectorVest Watchdog
- StockCharts.com, Inc.
- Candle Patterns
- Candlestick Charting Explained
- Intermarket Technical Analysis
- John Murphy on Chart Analysis
- John Murphy's Chart Pattern Recognition
- John Murphy's Market Message
- MurphyExplainsMarketAnalysis-Intermarket Analysis
- MurphyExplainsMarketAnalysis-Visual Analysis
- StockCharts.com
- Technical Analysis of the Financial Markets
- The Visual Investor
