HOT TOPICS LIST
- MACD
- Fibonacci
- RSI
- Gann
- ADXR
- Stochastics
- Volume
- Triangles
- Futures
- Cycles
- Volatility
- ZIGZAG
- MESA
- Retracement
- Aroon
INDICATORS LIST
LIST OF TOPICS
PRINT THIS ARTICLE
by Kevin Hopson
Apache Corp. has been in a steady uptrend for the last 10 months but is now approaching a key resistance level.
Position: Hold
Kevin Hopson
Kevin has been a technical analyst for roughly 10 years now. Previously, Kevin owned his own business and acted as a registered investment advisor, specializing in energy. He was also a freelance oil analyst for Orient Trading Co., a commodity futures trading firm in Japan. Kevin is currently a freelance writer.
PRINT THIS ARTICLE
TECHNICAL ANALYSIS
Apache Corporation Testing Key Resistance
09/04/03 12:10:49 PMby Kevin Hopson
Apache Corp. has been in a steady uptrend for the last 10 months but is now approaching a key resistance level.
Position: Hold
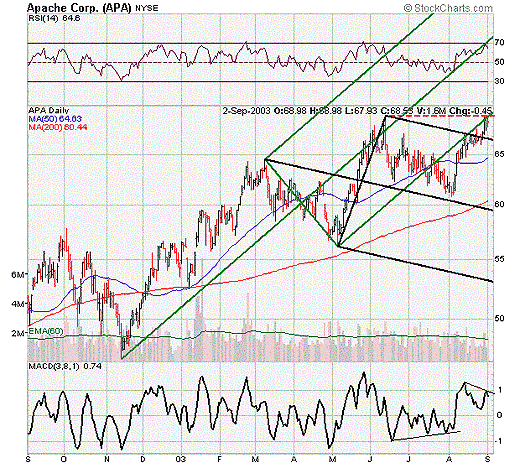
| Apache Corp. (APA) has been in a nice uptrend since November of last year, appreciating roughly 47 percent since then. However, the stock is now testing key resistance around the $69.00 level. Will Apache break through and hit a new 52-week high in the process or will the stock proceed to pull back from current levels? If we look at the one-year chart for Apache, we may be able to draw our own conclusion. |
| For example, notice how the moving average convergence/divergence (MACD) put in higher lows between mid-June and early August, while the stock price continued to decline. This was a bullish divergence on the chart and indicated a potential bottoming pattern. As you can see, Apache eventually broke to the upside, thus confirming this pattern. |

|
| Graphic provided by: Stockcharts.com. |
| |
| Unfortunately, the MACD is now putting in lower highs despite the fact that the stock price continues to move higher. Additionally, Apache is facing significant overhead around the $69.00 level, site of its 52-week high (dotted red line) and the bottom green parallel line. Given the bearish divergence we are seeing on the chart and substantial resistance at slightly higher prices, I would be cautious on the stock in the near-term. |
Kevin has been a technical analyst for roughly 10 years now. Previously, Kevin owned his own business and acted as a registered investment advisor, specializing in energy. He was also a freelance oil analyst for Orient Trading Co., a commodity futures trading firm in Japan. Kevin is currently a freelance writer.
| Glen Allen, VA | |
| E-mail address: | hopson_1@yahoo.com |
Click here for more information about our publications!
Comments
Date: 09/10/03Rank: 4Comment:

Request Information From Our Sponsors
- StockCharts.com, Inc.
- Candle Patterns
- Candlestick Charting Explained
- Intermarket Technical Analysis
- John Murphy on Chart Analysis
- John Murphy's Chart Pattern Recognition
- John Murphy's Market Message
- MurphyExplainsMarketAnalysis-Intermarket Analysis
- MurphyExplainsMarketAnalysis-Visual Analysis
- StockCharts.com
- Technical Analysis of the Financial Markets
- The Visual Investor
- VectorVest, Inc.
- Executive Premier Workshop
- One-Day Options Course
- OptionsPro
- Retirement Income Workshop
- Sure-Fire Trading Systems (VectorVest, Inc.)
- Trading as a Business Workshop
- VectorVest 7 EOD
- VectorVest 7 RealTime/IntraDay
- VectorVest AutoTester
- VectorVest Educational Services
- VectorVest OnLine
- VectorVest Options Analyzer
- VectorVest ProGraphics v6.0
- VectorVest ProTrader 7
- VectorVest RealTime Derby Tool
- VectorVest Simulator
- VectorVest Variator
- VectorVest Watchdog
