HOT TOPICS LIST
- MACD
- Fibonacci
- RSI
- Gann
- ADXR
- Stochastics
- Volume
- Triangles
- Futures
- Cycles
- Volatility
- ZIGZAG
- MESA
- Retracement
- Aroon
INDICATORS LIST
LIST OF TOPICS
PRINT THIS ARTICLE
by Koos van der Merwe
JDS Uniphase is listed both in Canada and the U.S., with Canada its primary base. With the Canadian market faltering because of a slowing economy while the U.S. market is recovering far better than anticipated, the share movement may be torn between the two.
Position: Accumulate
Koos van der Merwe
Has been a technical analyst since 1969, and has worked as a futures and options trader with First Financial Futures in Johannesburg, South Africa.
PRINT THIS ARTICLE
ELLIOTT WAVE
JDS Uniphase: A Lesson In Frustration
09/08/03 08:52:22 AMby Koos van der Merwe
JDS Uniphase is listed both in Canada and the U.S., with Canada its primary base. With the Canadian market faltering because of a slowing economy while the U.S. market is recovering far better than anticipated, the share movement may be torn between the two.
Position: Accumulate
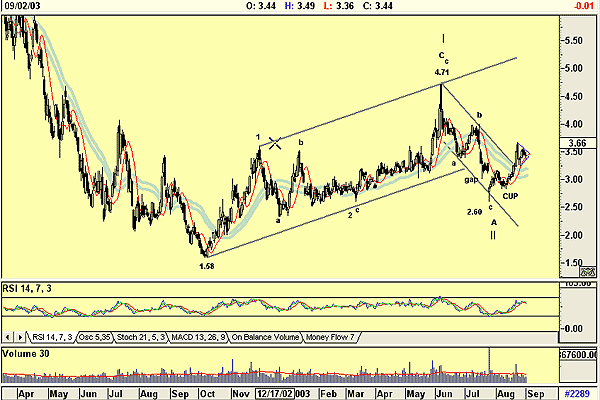
| At its height, JDS Uniphase was one of the most successful companies on the market, trading as high as $153.42 on March 31, 2000. It fell to a low of $1.58 on October 11, 2002. On August 22, 2003, Mr. Jozef Straus announced that he would be stepping down as chief executive officer. Mr. Straus built the company from scratch and enjoyed the status of being a shrewd entrepreneur, always wearing his trademark beret. With Mr. Straus leaving, JDS Uniphase has lost its beret. What now? |
| Attempting a wave count on the share price is next to impossible. Too many assumptions must be made, and the first rule of Elliott states, "The wave count must look right." The chart of JDSU looks as though it has completed its bear collapse and is trying desperately to recover. Under normal circumstances I would leave the company alone and look for one where the wave count is far more easily read. However, the company has changed management. The new management and a possible share price recovery intrigues me, and I am therefore attempting the following technical analysis. |

|
| Figure 1: JDS Uniphase. The chart is of JDSU-Q. |
| Graphic provided by: AdvancedGET. |
| |
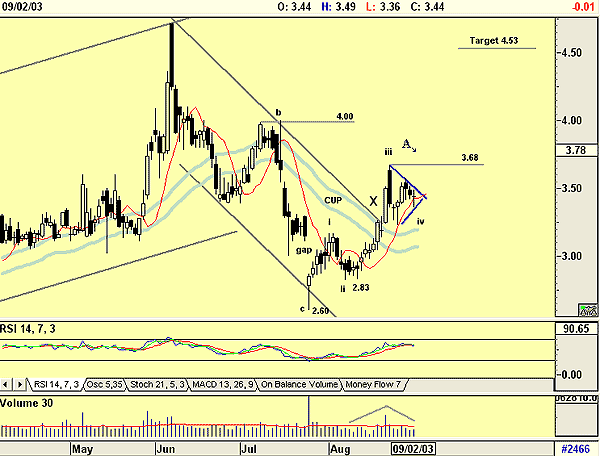
| JDS recovered from $1.58 to $4.71 on June 6, 2003, which I labeled Wave I on the chart. Then the stock fell, ignominiously gapping down to a low of $2.60 on July 25th in a classic three wave bear pattern. This could be the end of Wave II. The problem is, wave 1 of Wave I looks incomplete. I found it difficult to determine a major impulse wave. I must therefore assume that it is true, until future price movements clarify the wave count. Based on this assumption, and the recent moves of the share which have broken its downward resistance line, I must also assume that the price is now moving in a Wave III pattern upwards. Whether it is depends on the following, and here I refer to the second chart. |
 1. The first thing you see is that the price has broken above its short-term downtrend line. This makes the share look very promising for the short-term. 2. The second thing you see is a possible cup and handle formation. The gap in the left side destroys this image, so I discard the pattern. The price however, did rise to fill the gap, then fell to retest the low and a higher level, forming what could be a double bottom. This could be waves 1 and 2 of a rising impulse wave. 3. The next thing to note is a consolidation triangle. This does suggest that should the price break out of this triangle upwards, it could reach $4.53. I have shown this triangle as waves 3 and 4 of the impulse wave. 4. The RSI indicator is trending upwards, suggesting strength. 5. Volume rose as the share price rose, and fell as the share price consolidated. Both suggest strength. 6. Finally, at 'X' on the chart, the price broke above the upper JM internal band, a 28-day moving average offset by 2% positive and -2% negative. The band at these parameters has not been that convincing, but it can be noted. In conclusion, by all accounts, and due to the uncertainty of wave analysis, you should leave this share alone, but the change in management, and the growing optimism in the market, insists that you should keep looking at what was once a very high flyer. |
Has been a technical analyst since 1969, and has worked as a futures and options trader with First Financial Futures in Johannesburg, South Africa.
| Address: | 3256 West 24th Ave |
| Vancouver, BC | |
| Phone # for sales: | 6042634214 |
| E-mail address: | petroosp@gmail.com |
Click here for more information about our publications!
Comments

Request Information From Our Sponsors
- StockCharts.com, Inc.
- Candle Patterns
- Candlestick Charting Explained
- Intermarket Technical Analysis
- John Murphy on Chart Analysis
- John Murphy's Chart Pattern Recognition
- John Murphy's Market Message
- MurphyExplainsMarketAnalysis-Intermarket Analysis
- MurphyExplainsMarketAnalysis-Visual Analysis
- StockCharts.com
- Technical Analysis of the Financial Markets
- The Visual Investor
- VectorVest, Inc.
- Executive Premier Workshop
- One-Day Options Course
- OptionsPro
- Retirement Income Workshop
- Sure-Fire Trading Systems (VectorVest, Inc.)
- Trading as a Business Workshop
- VectorVest 7 EOD
- VectorVest 7 RealTime/IntraDay
- VectorVest AutoTester
- VectorVest Educational Services
- VectorVest OnLine
- VectorVest Options Analyzer
- VectorVest ProGraphics v6.0
- VectorVest ProTrader 7
- VectorVest RealTime Derby Tool
- VectorVest Simulator
- VectorVest Variator
- VectorVest Watchdog
