HOT TOPICS LIST
- MACD
- Fibonacci
- RSI
- Gann
- ADXR
- Stochastics
- Volume
- Triangles
- Futures
- Cycles
- Volatility
- ZIGZAG
- MESA
- Retracement
- Aroon
INDICATORS LIST
LIST OF TOPICS
PRINT THIS ARTICLE
by Gary Grosschadl
The S&P 500 (SPX) needs to confirm the Dow's move above its recent trading range, otherwise the move is questionable.
Position: N/A
Gary Grosschadl
Independent Canadian equities trader and technical analyst based in Peterborough
Ontario, Canada.
PRINT THIS ARTICLE
Will The S&P 500 Confirm The Recent Dow Thrust?
09/04/03 12:31:23 PMby Gary Grosschadl
The S&P 500 (SPX) needs to confirm the Dow's move above its recent trading range, otherwise the move is questionable.
Position: N/A
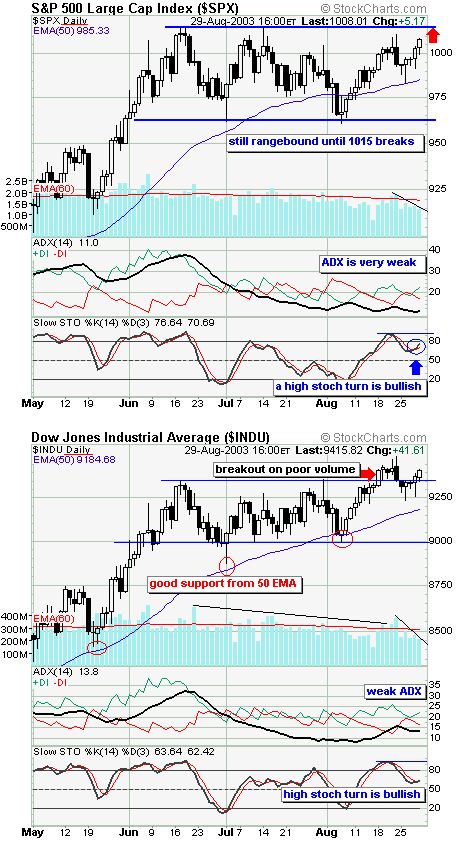
| Ten days ago the Dow finally rose above its trading range of several months. Trouble is that it did so on unconvincing volume and the SPX failed to confirm this move with its own breakout move. Technicians distrust pattern breaks on relatively poor volume as these moves often falter. Now that August is behind us, many anticipate higher trading volumes returning and the action these next few weeks will be closely followed. |
| After the Dow's recent breakout attempt on unconvincing volume, a brief retracement ensued, followed by yet another poke past its trading range. The SPX still has not followed suit. Will this change with better anticipated volumes likely return this week? Recent market action suggests that a challenge of previous highs is likely coming soon. Convincing volume for a successful move past the SPX 1015 level should be in the realm of 2.5 billion shares versus the relatively meager 1 to 1.5 billion shares of recent days. |

|
| Daily charts for the S&P 500 and the Dow. |
| Graphic provided by: Stockcharts.com. |
| |
| Besides the volume considerations, I've examined two other indicators. The directional movement indicator with its three components are illustrated. This trend strength indicator uses the ADX line as its strength component. This ADX value is weak for both indices at 11 and 13.8. Ideally this line should be positioned between the DI lines, upsloping and higher than 20, this 20 level being somewhat subjective with some traders preferring levels above 25 or 30. For starters we need to see this ADX line at least move above the -DI line to show growing trend strength. |
| The stochastics indicator, a non-trending oscillator that moves from oversold to overbought levels, shows a more positive tone. A high stochastics turn (above 50 and below 80) is deemed bullish as it reflects a move off a brief retracement. There is upside room here before overbought levels above 80 are reached again. A stochastic downturn typically begins with a move back down below 80 and this implies upside room this coming week before these conditions are met. Added bullishness could have stochastics "sticking" high for a longer period of time but a big improvement in the ADX line would likely have to occur first. |
| Market watchers and traders will likely be watching the upper limit of the SPX at 1015 closely this week for signs of a key move developing. The burning questions is: can the SPX forge past this resistance level (confirming Dow bullish intent) and if so, how far? |
Independent Canadian equities trader and technical analyst based in Peterborough
Ontario, Canada.
| Website: | www.whatsonsale.ca/financial.html |
| E-mail address: | gwg7@sympatico.ca |
Click here for more information about our publications!
PRINT THIS ARTICLE

Request Information From Our Sponsors
- StockCharts.com, Inc.
- Candle Patterns
- Candlestick Charting Explained
- Intermarket Technical Analysis
- John Murphy on Chart Analysis
- John Murphy's Chart Pattern Recognition
- John Murphy's Market Message
- MurphyExplainsMarketAnalysis-Intermarket Analysis
- MurphyExplainsMarketAnalysis-Visual Analysis
- StockCharts.com
- Technical Analysis of the Financial Markets
- The Visual Investor
- VectorVest, Inc.
- Executive Premier Workshop
- One-Day Options Course
- OptionsPro
- Retirement Income Workshop
- Sure-Fire Trading Systems (VectorVest, Inc.)
- Trading as a Business Workshop
- VectorVest 7 EOD
- VectorVest 7 RealTime/IntraDay
- VectorVest AutoTester
- VectorVest Educational Services
- VectorVest OnLine
- VectorVest Options Analyzer
- VectorVest ProGraphics v6.0
- VectorVest ProTrader 7
- VectorVest RealTime Derby Tool
- VectorVest Simulator
- VectorVest Variator
- VectorVest Watchdog
