HOT TOPICS LIST
- MACD
- Fibonacci
- RSI
- Gann
- ADXR
- Stochastics
- Volume
- Triangles
- Futures
- Cycles
- Volatility
- ZIGZAG
- MESA
- Retracement
- Aroon
INDICATORS LIST
LIST OF TOPICS
PRINT THIS ARTICLE
by Gary Grosschadl
These big currencies often battle each other for supremacy, moving most times as mirror images.
Position: N/A
Gary Grosschadl
Independent Canadian equities trader and technical analyst based in Peterborough
Ontario, Canada.
PRINT THIS ARTICLE
MOVING AVERAGES
US Dollar And Euro Fighting Same Battle
09/02/03 08:22:56 AMby Gary Grosschadl
These big currencies often battle each other for supremacy, moving most times as mirror images.
Position: N/A
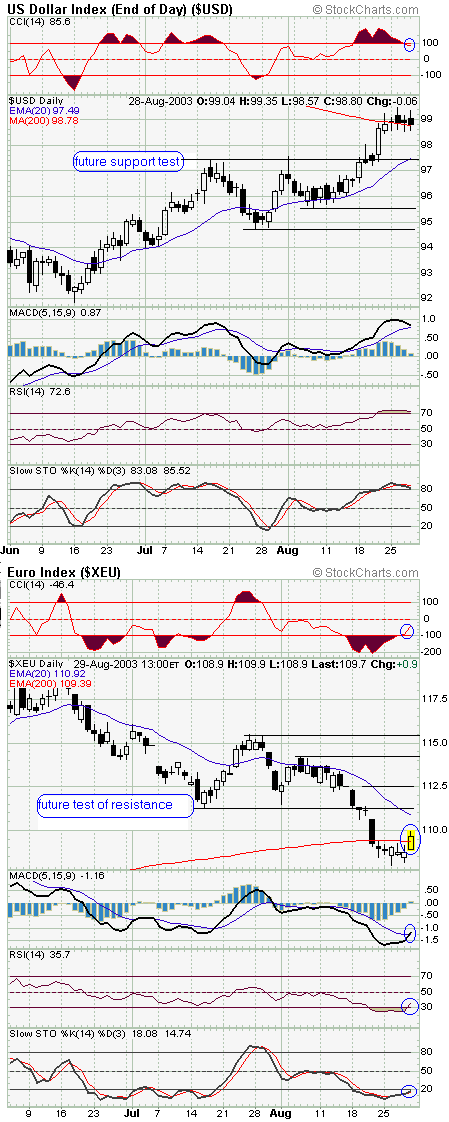
| As these charts show, a turn is likely in the making and these two currencies often turn together but move in opposite directions. When the USD is peaking, the Euro is often coming off a bottom. |
| This mirror image move is all the more apparent when the 200-day moving average is plotted. Just as one currency fights this prominent MA (SMA or EMA as they are both very similar in this case) from a resistance point of view, the other is making a move off its 200-day MA support. Note that both have slightly overshot the precise line somewhat. |

|
| Daily currency charts showing likely turns at the 200-day moving averages. |
| Graphic provided by: Stockcharts.com. |
| |
| The USD chart shows end of day data while the $XEU is a look at the current daily chart still forming. If this $XEU pattern holds into the close today, one can expect the indicators for the USD to show similar turns at the same crucial points. The current weight of evidence on these daily charts suggest a turn is in the making, a bearish downturn for the USD while the Euro is in the midst of a bullish turn. Next day confirmation adds more credence. |
| The probable initial tests for both charts are shown by the black horizontal lines which closely relate to significant previous candlesticks and the respective 20-day EMA lines. Watch these areas closely for either another reversal or a very bullish/bearish thrust through these levels. |
| Why should market watchers care what happens here? Traders of gold stocks often see gold move with the Euro while the main equities and market indices very often follow the USD at turning points especially. These intermarket relationships are closely watched by traders as they try to gain insight into any new trends that may develop. |
Independent Canadian equities trader and technical analyst based in Peterborough
Ontario, Canada.
| Website: | www.whatsonsale.ca/financial.html |
| E-mail address: | gwg7@sympatico.ca |
Click here for more information about our publications!
Comments
Date: 09/10/03Rank: 5Comment:

Request Information From Our Sponsors
- VectorVest, Inc.
- Executive Premier Workshop
- One-Day Options Course
- OptionsPro
- Retirement Income Workshop
- Sure-Fire Trading Systems (VectorVest, Inc.)
- Trading as a Business Workshop
- VectorVest 7 EOD
- VectorVest 7 RealTime/IntraDay
- VectorVest AutoTester
- VectorVest Educational Services
- VectorVest OnLine
- VectorVest Options Analyzer
- VectorVest ProGraphics v6.0
- VectorVest ProTrader 7
- VectorVest RealTime Derby Tool
- VectorVest Simulator
- VectorVest Variator
- VectorVest Watchdog
- StockCharts.com, Inc.
- Candle Patterns
- Candlestick Charting Explained
- Intermarket Technical Analysis
- John Murphy on Chart Analysis
- John Murphy's Chart Pattern Recognition
- John Murphy's Market Message
- MurphyExplainsMarketAnalysis-Intermarket Analysis
- MurphyExplainsMarketAnalysis-Visual Analysis
- StockCharts.com
- Technical Analysis of the Financial Markets
- The Visual Investor
