HOT TOPICS LIST
- MACD
- Fibonacci
- RSI
- Gann
- ADXR
- Stochastics
- Volume
- Triangles
- Futures
- Cycles
- Volatility
- ZIGZAG
- MESA
- Retracement
- Aroon
INDICATORS LIST
LIST OF TOPICS
PRINT THIS ARTICLE
by Kevin Hopson
Comstock Resources broke out of a falling wedge formation earlier this month and has now broken to the upside from its recent trading range.
Position: Hold
Kevin Hopson
Kevin has been a technical analyst for roughly 10 years now. Previously, Kevin owned his own business and acted as a registered investment advisor, specializing in energy. He was also a freelance oil analyst for Orient Trading Co., a commodity futures trading firm in Japan. Kevin is currently a freelance writer.
PRINT THIS ARTICLE
TECHNICAL ANALYSIS
Comstock Resources' Falling Wedge And Trading Range Breakout
08/29/03 09:14:07 AMby Kevin Hopson
Comstock Resources broke out of a falling wedge formation earlier this month and has now broken to the upside from its recent trading range.
Position: Hold
| Comstock Resources (CRK) is an oil and gas exploration and production company with primary operations in the Gulf of Mexico, Texas, Louisiana, Oklahoma, Kansas and Kentucky. The stock has had a beautiful run this year, appreciating nearly 60 percent from late March to mid-June. Though Comstock gave back roughly 17 percent of these gains over the next two months, there were clear signs that the long-term uptrend would resume. |
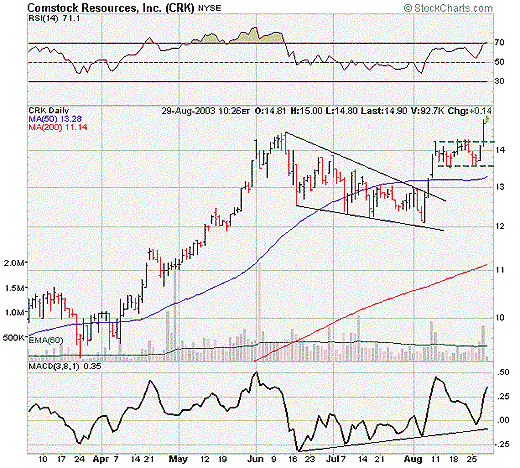
| For example, if you look at the six-month chart for Comstock, you will notice that the stock formed a falling wedge during its summer correction. This is usually a bullish sign, as wedges tend to break in the opposite direction. Additionally, the moving average convergence/divergence was putting in a pattern of higher lows despite the fact that the stock price was continuing to decline. This was a bullish divergence on the chart, thus indicating a potential bottoming pattern in the stock. As you can see, this proved to be correct, as Comstock recently broke out of its falling wedge formation and is now moving higher. |

|
| Graphic provided by: Stockcharts.com. |
| |
| However, the bullish technicals did not stop there. More specifically, the stock proceeded to form a bullish rectangle, which is basically the formation of a trading channel after a steep run-up in price. Bullish rectangles (or trading channels) tend to be continuation patterns. Since the prior move was up, it was likely that Comstock would see a further break to the upside. As you can see, this has now occurred. |
| Now that Comstock has broken out of its trading range, the next upside target appears to be the $15.40 to $16.00 range. To calculate this, just take the width of the trading range ($0.60), multiply it by the number of times the stock tested the upper channel line (3) and then add this total ($1.80) to the bottom ($13.60) and top ($14.20) channel lines. When you do this, you come up with a target price range of $15.40 to $16.00. As a result, it looks like Comstock Resources has additional upside potential in the near-term. |
Kevin has been a technical analyst for roughly 10 years now. Previously, Kevin owned his own business and acted as a registered investment advisor, specializing in energy. He was also a freelance oil analyst for Orient Trading Co., a commodity futures trading firm in Japan. Kevin is currently a freelance writer.
| Glen Allen, VA | |
| E-mail address: | hopson_1@yahoo.com |
Click here for more information about our publications!
Comments
Date: 09/02/03Rank: 5Comment: Thanks for following the undercovered small cap energy independents. Thats where the most money is going to be made. Not in the large cap energy stocks. I bought into SFY on your recommendation after observing it carve out its long base. I was on it when it broke out. I have owned CRK since 9 and then sold it for a tidy profit between 13-14 when it was consolidating in the falling wedge. I then bought on the breakout at 14.00 reaching the conclusion on my t/a and volume analysis that it would not breach the 10ema at 13.60. Its worked like a charm.
I have a request. Could you do an article on NGAS? I made some great profits on it from 1.25. Then sold when it was forming the symetrical triangle. Just recently bought back in on the symetrical triangle breakout at 4.60. It has broken out again closing at 5.00. It too is working like a charm.
Date: 09/07/03Rank: 5Comment:

Request Information From Our Sponsors
- VectorVest, Inc.
- Executive Premier Workshop
- One-Day Options Course
- OptionsPro
- Retirement Income Workshop
- Sure-Fire Trading Systems (VectorVest, Inc.)
- Trading as a Business Workshop
- VectorVest 7 EOD
- VectorVest 7 RealTime/IntraDay
- VectorVest AutoTester
- VectorVest Educational Services
- VectorVest OnLine
- VectorVest Options Analyzer
- VectorVest ProGraphics v6.0
- VectorVest ProTrader 7
- VectorVest RealTime Derby Tool
- VectorVest Simulator
- VectorVest Variator
- VectorVest Watchdog
- StockCharts.com, Inc.
- Candle Patterns
- Candlestick Charting Explained
- Intermarket Technical Analysis
- John Murphy on Chart Analysis
- John Murphy's Chart Pattern Recognition
- John Murphy's Market Message
- MurphyExplainsMarketAnalysis-Intermarket Analysis
- MurphyExplainsMarketAnalysis-Visual Analysis
- StockCharts.com
- Technical Analysis of the Financial Markets
- The Visual Investor
