HOT TOPICS LIST
- MACD
- Fibonacci
- RSI
- Gann
- ADXR
- Stochastics
- Volume
- Triangles
- Futures
- Cycles
- Volatility
- ZIGZAG
- MESA
- Retracement
- Aroon
INDICATORS LIST
LIST OF TOPICS
PRINT THIS ARTICLE
by David Penn
A head and shoulders top in the regional banks HOLDR suggests a correction is near.
Position: N/A
David Penn
Technical Writer for Technical Analysis of STOCKS & COMMODITIES magazine, Working-Money.com, and Traders.com Advantage.
PRINT THIS ARTICLE
HEAD & SHOULDERS
Bye, Bye Banks?
08/29/03 10:57:22 AMby David Penn
A head and shoulders top in the regional banks HOLDR suggests a correction is near.
Position: N/A
| Whether or not the Federal Reserve Board has mastered the business cycle, the traditional sector rotation that occurs during the shifts of the business cycle continues on. This sector rotation -- articulately described by many authors, including Sam Stovall in his 1995 text, Standard & Poor's Guide to Sector Investing -- remains one of the key ways that many investors and traders not only determine when to get into the stock market, but also just which sectors are likely to outperform others. By burrowing down beneath the specific sectors to examine specific stocks, traders and investors who follow sector rotation can often uncover even more profitable opportunities. |
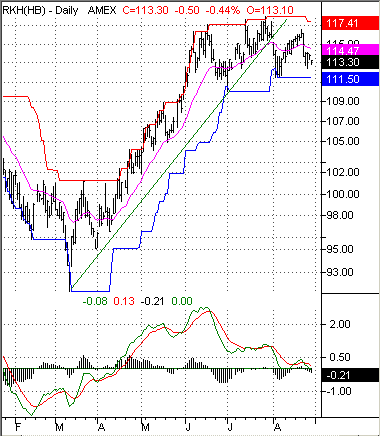
| In a nutshell, the business cycle is a movement from economic expansion to economic contraction and back again. In Stovall's assessment, which mirrors that of others, this cycle consists of five stages: early expansion, middle expansion, late expansion, early contraction, and late contraction. During each stage, there are one or two sectors that are likely to outperform their peers. Early expansion, for example, tends to see outperformance in transportation stocks (think of the Dow theory's use of the Dow Transports as a leading and confirming indicator) and technology (think of how frequently market commentators point out that a healthy stock market begins with the Nasdaq). Early contraction, by contrast, features outperformance by consumer staples and utilities stocks. Why? Because consumer staples such as foods, tobacco and health care continue to enjoy relatively high demand even during economic downturns. Utilities stocks also tend to fare well in the early stages of contraction because their higher dividend yields become more attractive as prospects for capital appreciation (i.e. rising stock prices) have dimmed. One of the things about combining technical analysis with sector rotation is that a technical analyst can determine by way of the relative strength of the various price charts not only which sectors are outperforming, but where the economy is in the business cycle. Consider, for example, the head and shoulders top that appears to be developing in the regional banks HOLDR, RKH. |

|
| Note the sharp negative divergence between the MACD indicator and the three tops in the RKH. |
| Graphic provided by: TradeStation. |
| |
| Financial stocks tend to outperform during the early contraction phase of the business cycle. This is because the early contraction phase is usually accompanied by government efforts -- particularly the Federal Reserve -- to "stimulate" the economy by way of lowering interest rates. Because of this, many sector-oriented traders consider outperformance by financial stocks to be as much a sign of early expansion as of early contraction -- in other words, looking to get in on an economic recovery early, many traders will bid up the prices of financial stocks in advance of actual evidence that monetary "stimulus" has taken hold. |
| What this means, in part, is that when financial stocks are topping out, the additional stimulus part of the contraction is over. By the time the financial stocks have started moving back down, sector-aware traders begin looking for the effects of financial stimulus in other sectors -- particularly in capital goods and basic materials. Thus, it should be of little surprise that as the banks have started to top out, stocks in companies like Caterpillar (CAT) and 3M (MMM) have broken out and moved higher. In any event, the banks appear to be topping -- at least as reflected by the RKH. This top has taken on the form of a head and shoulders top, with the right shoulder of this pattern still to be completed. If this shoulder is completed by prices moving down to the neckline between 111 and 110, then the likelihood of a bearish reversal would be quite high. Given the size of the formation, a decline to 103 or 104 should not be unexpected should prices break down below neckline support. |
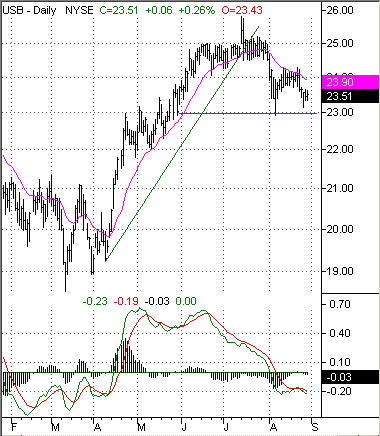
| It is also worth noting that the RKH is manifesting a 1-2-3 trend reversal. All that remains is follow-through to the downside (the "3" move), in the wake of the failed attempt to regain the previous uptrend (the "2" move). What about individual stocks? The largest components of the RKH by share amount are stocks like U.S. Bancorp (USB), Wachovia Corporation (WB), Bank One Corporation (ONE), FleetBoston Financial (FBF) and Wells Fargo & Company (WFC). Taking a look at the charts of these companies, some of the same topping action is apparent as it is in the regional banks HOLDR. Consider this chart of U.S. Bancorp.  Figure 2: A break beneath 23 could send shares of U.S. Bancorp on a ride back to 20. |
Technical Writer for Technical Analysis of STOCKS & COMMODITIES magazine, Working-Money.com, and Traders.com Advantage.
| Title: | Technical Writer |
| Company: | Technical Analysis, Inc. |
| Address: | 4757 California Avenue SW |
| Seattle, WA 98116 | |
| Phone # for sales: | 206 938 0570 |
| Fax: | 206 938 1307 |
| Website: | www.Traders.com |
| E-mail address: | DPenn@traders.com |
Traders' Resource Links | |
| Charting the Stock Market: The Wyckoff Method -- Books | |
| Working-Money.com -- Online Trading Services | |
| Traders.com Advantage -- Online Trading Services | |
| Technical Analysis of Stocks & Commodities -- Publications and Newsletters | |
| Working Money, at Working-Money.com -- Publications and Newsletters | |
| Traders.com Advantage -- Publications and Newsletters | |
| Professional Traders Starter Kit -- Software | |
Click here for more information about our publications!
Comments
Date: 09/02/03Rank: 3Comment:
Date: 09/03/03Rank: 3Comment:
Date: 09/03/03Rank: 5Comment:

|

Request Information From Our Sponsors
- StockCharts.com, Inc.
- Candle Patterns
- Candlestick Charting Explained
- Intermarket Technical Analysis
- John Murphy on Chart Analysis
- John Murphy's Chart Pattern Recognition
- John Murphy's Market Message
- MurphyExplainsMarketAnalysis-Intermarket Analysis
- MurphyExplainsMarketAnalysis-Visual Analysis
- StockCharts.com
- Technical Analysis of the Financial Markets
- The Visual Investor
- VectorVest, Inc.
- Executive Premier Workshop
- One-Day Options Course
- OptionsPro
- Retirement Income Workshop
- Sure-Fire Trading Systems (VectorVest, Inc.)
- Trading as a Business Workshop
- VectorVest 7 EOD
- VectorVest 7 RealTime/IntraDay
- VectorVest AutoTester
- VectorVest Educational Services
- VectorVest OnLine
- VectorVest Options Analyzer
- VectorVest ProGraphics v6.0
- VectorVest ProTrader 7
- VectorVest RealTime Derby Tool
- VectorVest Simulator
- VectorVest Variator
- VectorVest Watchdog
