HOT TOPICS LIST
- MACD
- Fibonacci
- RSI
- Gann
- ADXR
- Stochastics
- Volume
- Triangles
- Futures
- Cycles
- Volatility
- ZIGZAG
- MESA
- Retracement
- Aroon
INDICATORS LIST
LIST OF TOPICS
PRINT THIS ARTICLE
by Koos van der Merwe
Last week I discussed the Dow and its cycle, the week before, the S&P 100 index and its cycle. This week I am looking at the Nasdaq index, its cycle and other technical tools.
Position: N/A
Koos van der Merwe
Has been a technical analyst since 1969, and has worked as a futures and options trader with First Financial Futures in Johannesburg, South Africa.
PRINT THIS ARTICLE
ELLIOTT WAVE
Nasdaq And Its Cycle: Is There A Joker In The Pack?
08/29/03 10:59:55 AMby Koos van der Merwe
Last week I discussed the Dow and its cycle, the week before, the S&P 100 index and its cycle. This week I am looking at the Nasdaq index, its cycle and other technical tools.
Position: N/A
| The Dow index consists of only 35 stocks. The S&P 100 index has 100, but the Nasdaq Composite Index measures all Nasdaq domestic and international-based common stocks listed on the Nasdaq stock market. Today the Nasdaq Composite includes over 4,000 companies, more than most other stock market indices. |
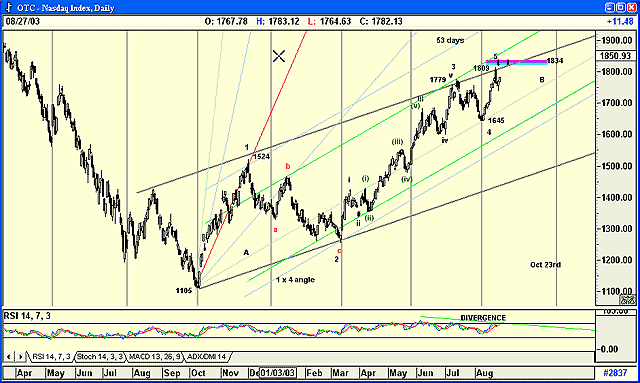
| Analyzing the Nasdaq Index is quite simple. An Elliott wave suggests that it could rise to the 1834 level to complete wave 5, as shown by the MOB (make or break) target. I have explained the MOB in detail in previous cycle articles, so shall not explain it again. It is accurate, but its definition does allow for an error: if the price should penetrate and exceed it, then the price will exit the MOB level at the same distance it entered it. |

|
| Nasdaq cycle with Elliott and Gann analysis. |
| Graphic provided by: AdvancedGET. |
| |
| This seems reasonable enough, and with the Nasdaq Index at the moment kissing the upper resistance line, one could say that the fifth wave target has been fulfilled at 1809, but the first rule of Elliott casts doubt. The first rule states the chart must look right, and with wave one and wave two being so large, the chart looks unbalanced with such a small wave 4. Remember, if wave 2 is complicated, wave 4 will be simple, so perhaps it is acceptable, which means that wave 5 could be a failure. Then again, wave 5 should be the same length as wave 1, which means that wave 5 should top at 2064 (1524-1105 = 419 added to the bottom of wave 4 = 1645 + 419 = 2064), still a long way to go. |
| Because of the doubt that exists, I decided to analyze the chart in greater depth. To do this I have used a little known Gann technique I was taught years ago, and used for trading the futures market. I have drawn a Gann fan from the low at 1105, and being a traditionalist, I have used a scale of 10, which shows the 1 X 1 angle tracing out the rise of wave 1 (red line). I then take parallels of the 1 X 4 angle, and project them from each pivot point, as shown on the chart. The fenced area between the 1 X 4 parallels drawn from '1' and from 'b' could most likely be the site for a 5th wave top. This will only happen if wave 5 equals wave 1 as suggested above, which means that the wave would have to be a rising wedge, breaking through the MOB line and extending the same distance above as below. |
| The counts against the above happening are the double top that has formed at 1809, the upper resistance trendline the index is bumping against, and the divergence weakness shown by the RSI indicator. This in itself is a very powerful negative. Do remember, should the Nasdaq start falling from present levels into the low of October 23rd, it will have topped out before the cyclical midpoint, which is a very strong bear signal. Is the U.S. economy recovering? So far, the Nasdaq doesn't seem to think so, but then you never know. There may be a joker in the pack. |
Has been a technical analyst since 1969, and has worked as a futures and options trader with First Financial Futures in Johannesburg, South Africa.
| Address: | 3256 West 24th Ave |
| Vancouver, BC | |
| Phone # for sales: | 6042634214 |
| E-mail address: | petroosp@gmail.com |
Click here for more information about our publications!
Comments
Date: 08/31/03Rank: 4Comment:
Date: 09/02/03Rank: 4Comment:

Request Information From Our Sponsors
- StockCharts.com, Inc.
- Candle Patterns
- Candlestick Charting Explained
- Intermarket Technical Analysis
- John Murphy on Chart Analysis
- John Murphy's Chart Pattern Recognition
- John Murphy's Market Message
- MurphyExplainsMarketAnalysis-Intermarket Analysis
- MurphyExplainsMarketAnalysis-Visual Analysis
- StockCharts.com
- Technical Analysis of the Financial Markets
- The Visual Investor
- VectorVest, Inc.
- Executive Premier Workshop
- One-Day Options Course
- OptionsPro
- Retirement Income Workshop
- Sure-Fire Trading Systems (VectorVest, Inc.)
- Trading as a Business Workshop
- VectorVest 7 EOD
- VectorVest 7 RealTime/IntraDay
- VectorVest AutoTester
- VectorVest Educational Services
- VectorVest OnLine
- VectorVest Options Analyzer
- VectorVest ProGraphics v6.0
- VectorVest ProTrader 7
- VectorVest RealTime Derby Tool
- VectorVest Simulator
- VectorVest Variator
- VectorVest Watchdog
