HOT TOPICS LIST
- MACD
- Fibonacci
- RSI
- Gann
- ADXR
- Stochastics
- Volume
- Triangles
- Futures
- Cycles
- Volatility
- ZIGZAG
- MESA
- Retracement
- Aroon
INDICATORS LIST
LIST OF TOPICS
PRINT THIS ARTICLE
by Kevin Hopson
Berry Petroleum continues to be stuck in a trading range but the technicals point to higher prices down the road.
Position: Accumulate
Kevin Hopson
Kevin has been a technical analyst for roughly 10 years now. Previously, Kevin owned his own business and acted as a registered investment advisor, specializing in energy. He was also a freelance oil analyst for Orient Trading Co., a commodity futures trading firm in Japan. Kevin is currently a freelance writer.
PRINT THIS ARTICLE
TECHNICAL ANALYSIS
Is Berry Petroleum Preparing To Break Out?
08/28/03 12:06:53 PMby Kevin Hopson
Berry Petroleum continues to be stuck in a trading range but the technicals point to higher prices down the road.
Position: Accumulate
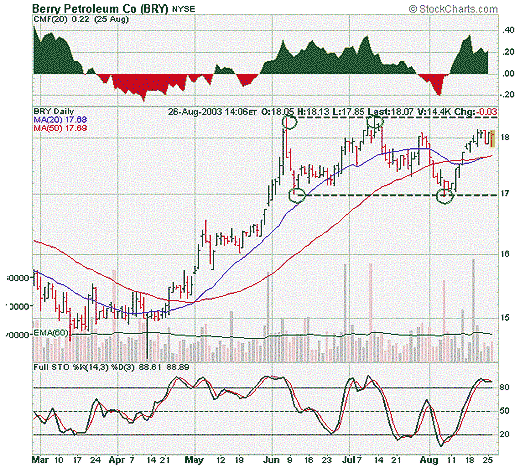
| The last time I touched on Berry Petroleum (BRY), the stock was stuck in a trading range between $17.00 and $18.40. Unfortunately, little has changed since then. However, the stock did test its lower channel line ($17.00) earlier this month, a price level that I said investors should look to buy at. As expected, Berry found support here and proceeded to move higher. |
| Though the stock continues to move sideways, the technicals point to higher prices ahead. For example, as I mentioned in my prior article, trading ranges tend to act as continuation patterns. In other words, prices will often consolidate before a resumption in the trend occurs. Since Berry is in a long-term uptrend, the stock should see an eventual break to the upside. |

|
| Graphic provided by: Stockcharts.com. |
| |
| If this holds true, Berry should make its way up to the $21.00 to $23.00 range in the longer-term. How do I come to this conclusion? It is very simple. If you look at the chart, you will notice that the stock has tested the top and bottom channel lines two times each (or four times overall). More often than not, prices will break in the direction of the fifth testing point. More specifically, if Berry tests the $18.40 level in the near-term, the stock should finally break resistance here. |
| If this occurs, Berry will have tested the top channel line three times. If you take this number (3) and multiply it by the width of the trading range ($1.40), you come up with $4.20. Add this number to the bottom channel price ($17.00) and the top channel price ($18.40) and you get a potential target range of $21.20 to $22.60. Given the stock's bullish technicals and long-term upside potential, I would continue to accumulate shares of Berry Petroleum on any price weakness. |
Kevin has been a technical analyst for roughly 10 years now. Previously, Kevin owned his own business and acted as a registered investment advisor, specializing in energy. He was also a freelance oil analyst for Orient Trading Co., a commodity futures trading firm in Japan. Kevin is currently a freelance writer.
| Glen Allen, VA | |
| E-mail address: | hopson_1@yahoo.com |
Click here for more information about our publications!
PRINT THIS ARTICLE

Request Information From Our Sponsors
- StockCharts.com, Inc.
- Candle Patterns
- Candlestick Charting Explained
- Intermarket Technical Analysis
- John Murphy on Chart Analysis
- John Murphy's Chart Pattern Recognition
- John Murphy's Market Message
- MurphyExplainsMarketAnalysis-Intermarket Analysis
- MurphyExplainsMarketAnalysis-Visual Analysis
- StockCharts.com
- Technical Analysis of the Financial Markets
- The Visual Investor
- VectorVest, Inc.
- Executive Premier Workshop
- One-Day Options Course
- OptionsPro
- Retirement Income Workshop
- Sure-Fire Trading Systems (VectorVest, Inc.)
- Trading as a Business Workshop
- VectorVest 7 EOD
- VectorVest 7 RealTime/IntraDay
- VectorVest AutoTester
- VectorVest Educational Services
- VectorVest OnLine
- VectorVest Options Analyzer
- VectorVest ProGraphics v6.0
- VectorVest ProTrader 7
- VectorVest RealTime Derby Tool
- VectorVest Simulator
- VectorVest Variator
- VectorVest Watchdog
