HOT TOPICS LIST
- MACD
- Fibonacci
- RSI
- Gann
- ADXR
- Stochastics
- Volume
- Triangles
- Futures
- Cycles
- Volatility
- ZIGZAG
- MESA
- Retracement
- Aroon
INDICATORS LIST
LIST OF TOPICS
PRINT THIS ARTICLE
by Gary Grosschadl
This Canadian semiconductor stock has been enjoying a rising trend but what is the bigger picture revealing?
Position: Hold
Gary Grosschadl
Independent Canadian equities trader and technical analyst based in Peterborough
Ontario, Canada.
PRINT THIS ARTICLE
CHART ANALYSIS
Zarlink Semiconductor May Be Fighting An Uphill Battle
08/25/03 10:44:28 AMby Gary Grosschadl
This Canadian semiconductor stock has been enjoying a rising trend but what is the bigger picture revealing?
Position: Hold
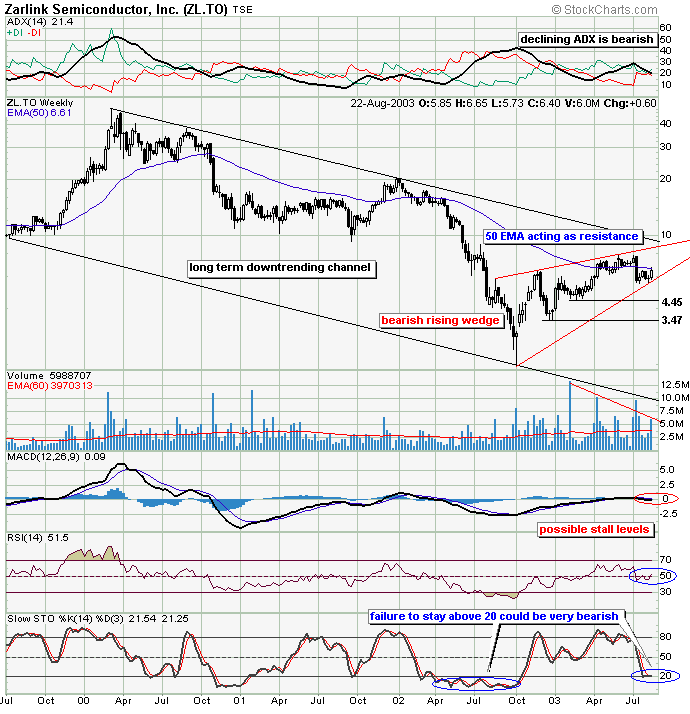
| The multi-year weekly chart of Zarlink Semiconductor (ZL) shows this technology stock in a large declining channel formation. I've used a semi-log chart as this generally presents a more accurate picture when large price range changes are viewed. Since moving bullishly off the lower trendline, things had been going very well until the stock came against its 50-week exponential moving average (EMA). A sideways battle ensued until the stock plunged under this moving average line. Now the EMA is acting as overhead resistance. While this has been going on, another potentially bearish pattern has emerged -- a rising wedge. Ideally volume should decline while this wedge forms and in this case the volume spikes have indeed diminished in size. |
| Should the stock move below this lower wedge trendline, ideally on large volume, then two downside targets are shown at 4.45 and 3.47. A move down to test the lower trendline seems unfathomable unless extremely bearish events occur. |

|
| Weekly semi-log chart showing a pattern within a pattern. |
| Graphic provided by: Stockcharts.com. |
| |
| The upper most indicator shows a declining ADX line. This is bearish as it shows the current (bullish) trend is weakening. Should this decline continue then the DIs could do a bearish cross, giving the bears control and the upper hand. The MACD (moving average convergence/divergence) indicator shows a potential stall at the zero line with a decline here being a bearish development. Likewise a stall and move below the RSI (relative strength index) 50 level would have similar bearish overtones, however it is still pointing up for now. Finally the stochastic indicator seems to show a reluctance to move much above the 20 level. As shown in a previous occasion, a sustained move below this line can have dire consequences. |
| In summary, this stock is a hold until its next move becomes more apparent. A move below the wedge trendline would bring a sell consideration (or short), whereas a move above the 50-week EMA could be interpreted as a bullish signal hinting at a drive towards the two upper trendlines. Watch for a high volume move in either direction to give a possible trade scenario. The daily chart should also be consulted for additional clues. I believe the daily chart shows greater downside than upside right now. If this is correct, the weekly chart will eventually confirm. The market should soon show us whether the bulls or bears prevail and a trading opportunity should ensue either way. |
Independent Canadian equities trader and technical analyst based in Peterborough
Ontario, Canada.
| Website: | www.whatsonsale.ca/financial.html |
| E-mail address: | gwg7@sympatico.ca |
Click here for more information about our publications!
PRINT THIS ARTICLE

|

Request Information From Our Sponsors
- StockCharts.com, Inc.
- Candle Patterns
- Candlestick Charting Explained
- Intermarket Technical Analysis
- John Murphy on Chart Analysis
- John Murphy's Chart Pattern Recognition
- John Murphy's Market Message
- MurphyExplainsMarketAnalysis-Intermarket Analysis
- MurphyExplainsMarketAnalysis-Visual Analysis
- StockCharts.com
- Technical Analysis of the Financial Markets
- The Visual Investor
- VectorVest, Inc.
- Executive Premier Workshop
- One-Day Options Course
- OptionsPro
- Retirement Income Workshop
- Sure-Fire Trading Systems (VectorVest, Inc.)
- Trading as a Business Workshop
- VectorVest 7 EOD
- VectorVest 7 RealTime/IntraDay
- VectorVest AutoTester
- VectorVest Educational Services
- VectorVest OnLine
- VectorVest Options Analyzer
- VectorVest ProGraphics v6.0
- VectorVest ProTrader 7
- VectorVest RealTime Derby Tool
- VectorVest Simulator
- VectorVest Variator
- VectorVest Watchdog
