HOT TOPICS LIST
- MACD
- Fibonacci
- RSI
- Gann
- ADXR
- Stochastics
- Volume
- Triangles
- Futures
- Cycles
- Volatility
- ZIGZAG
- MESA
- Retracement
- Aroon
INDICATORS LIST
LIST OF TOPICS
PRINT THIS ARTICLE
by Kevin Hopson
The Gold & Silver Index has been chugging higher the last several months but the technicals are indicating a potential reversal in the near future.
Position: N/A
Kevin Hopson
Kevin has been a technical analyst for roughly 10 years now. Previously, Kevin owned his own business and acted as a registered investment advisor, specializing in energy. He was also a freelance oil analyst for Orient Trading Co., a commodity futures trading firm in Japan. Kevin is currently a freelance writer.
PRINT THIS ARTICLE
TECHNICAL ANALYSIS
Gold & Silver Index Could Be Topping Out
08/25/03 10:32:50 AMby Kevin Hopson
The Gold & Silver Index has been chugging higher the last several months but the technicals are indicating a potential reversal in the near future.
Position: N/A
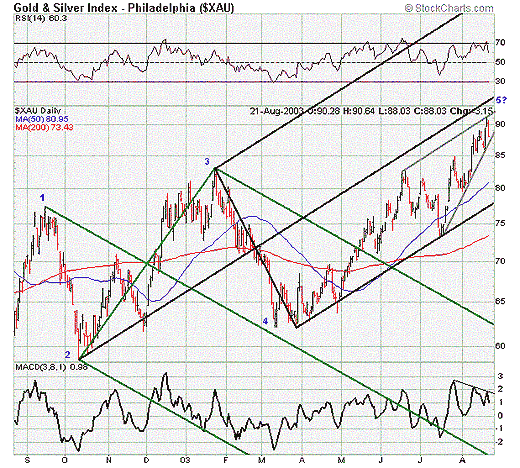
| The Philadelphia Gold & Silver Index (XAU) has had an excellent run the past year. However, a closer look at the technicals indicates a potential topping pattern in place. For example, based on Elliott wave theory and related pitchfork analysis, the XAU appears to be in the fifth and final wave of its long-term uptrend. The green (1-2/3) pitchfork helps confirm this, as completion of the fourth wave occurred right along the green median line. |
| Just to note, median lines tend to act as significant reversal points for prices. Since the median line of the green pitchfork is used to predict the completion point of the fourth wave and prices ended up reversing here, it is a good sign that the index is currently in the fifth wave of its long-term uptrend. Just like the green pitchfork can be used to predict the end of wave 4, the black (2-3/4) pitchfork can be used to predict the ultimate top or the completion of wave 5. As you can see, the index is quickly approaching the black median line, a point at which prices will likely reverse and move down. |

|
| Graphic provided by: Stockcharts.com. |
| |
| Even if this analysis proves to be faulty, there are other signs of trouble. For example, notice the index is forming a rising wedge: a pattern of higher highs and higher lows causing the trading range to contract. This tends to be a bearish pattern and is usually resolved by a reversal to the downside. Additionally, notice how the moving average convergence/divergence (MACD) has been putting in lower lows during the index's most recent advance. This is a bearish divergence, indicating prices could top out in the near-term. |
Kevin has been a technical analyst for roughly 10 years now. Previously, Kevin owned his own business and acted as a registered investment advisor, specializing in energy. He was also a freelance oil analyst for Orient Trading Co., a commodity futures trading firm in Japan. Kevin is currently a freelance writer.
| Glen Allen, VA | |
| E-mail address: | hopson_1@yahoo.com |
Click here for more information about our publications!
Comments
Date: 08/26/03Rank: 3Comment:
Date: 08/27/03Rank: 5Comment:
Date: 09/09/03Rank: 5Comment:

|

Request Information From Our Sponsors
- StockCharts.com, Inc.
- Candle Patterns
- Candlestick Charting Explained
- Intermarket Technical Analysis
- John Murphy on Chart Analysis
- John Murphy's Chart Pattern Recognition
- John Murphy's Market Message
- MurphyExplainsMarketAnalysis-Intermarket Analysis
- MurphyExplainsMarketAnalysis-Visual Analysis
- StockCharts.com
- Technical Analysis of the Financial Markets
- The Visual Investor
- VectorVest, Inc.
- Executive Premier Workshop
- One-Day Options Course
- OptionsPro
- Retirement Income Workshop
- Sure-Fire Trading Systems (VectorVest, Inc.)
- Trading as a Business Workshop
- VectorVest 7 EOD
- VectorVest 7 RealTime/IntraDay
- VectorVest AutoTester
- VectorVest Educational Services
- VectorVest OnLine
- VectorVest Options Analyzer
- VectorVest ProGraphics v6.0
- VectorVest ProTrader 7
- VectorVest RealTime Derby Tool
- VectorVest Simulator
- VectorVest Variator
- VectorVest Watchdog
