HOT TOPICS LIST
- MACD
- Fibonacci
- RSI
- Gann
- ADXR
- Stochastics
- Volume
- Triangles
- Futures
- Cycles
- Volatility
- ZIGZAG
- MESA
- Retracement
- Aroon
INDICATORS LIST
LIST OF TOPICS
PRINT THIS ARTICLE
by Koos van der Merwe
Last week I presented a chart and analysis of the S&P 100 index (OEX). This week I'll look at the Dow.
Position: Accumulate
Koos van der Merwe
Has been a technical analyst since 1969, and has worked as a futures and options trader with First Financial Futures in Johannesburg, South Africa.
PRINT THIS ARTICLE
ELLIOTT WAVE
The Dow And Its Cycle
08/21/03 09:34:16 AMby Koos van der Merwe
Last week I presented a chart and analysis of the S&P 100 index (OEX). This week I'll look at the Dow.
Position: Accumulate
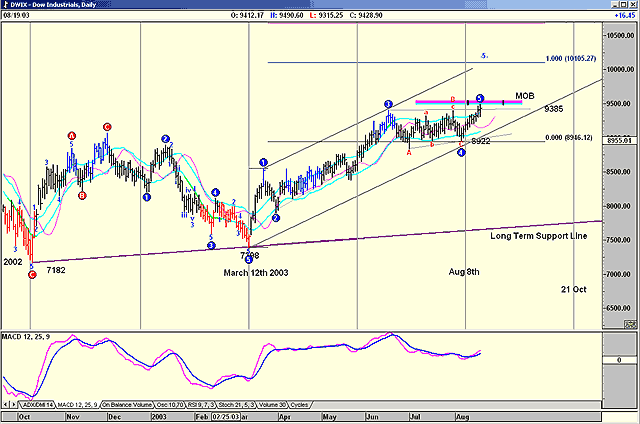
| I concluded my analysis of the S&P100 index by saying, "Is the U.S. economy recovering? The OEX suggests it is, but with plenty of hiccups along the way that will test the faint of heart. For the short-term however, the trend does appear to be up." Looking at the chart of the Dow, I can see the following. 1. The cycle is closer to 52 than 53 days. Whereas the OEX (S&P 100 Index) showed a cycle low on August 11th with the actual being August 6th, the Dow cycle gave a low on August 8th with the actual low being August 5th. 2. Both charts appear to be tracing a very complicated 4th wave pattern, but whereas the OEX suggested further upside movement of approximately 4%, as shown by the MOB (make or break) line projection, the Dow appears to be touching or at its MOB level. To recap, The MOB indicator has been designed by Advanced GET as a tool to help determine the target price of a wave 5. There is no PTI (probability factor) shown on the chart as the program has determined that Wave 5 could be complete, hence the blocking of the 5 on the chart. The MOB indicator is not a fixed resistance level, and according to Advanced GET, should a chart break above it, it should usually extend upwards the same distance it entered the indicator, so Wave 5 could be developing into a rising wedge, ending at 10105.27, close enough to the projected "5" shown on the chart. |
| 3. The MACD indicator is suggesting strength. MACD is a delayed oscillator because it is the difference between two exponential moving averages with a moving average trigger. The parameters are 12, 25, 9. 4. The parallel short-term support and resistance lines suggest that the Dow could top out at the 10105 level or higher, depending on the strength of the upward momentum. |

|
| Figure 1: The Dow and its cycle. |
| Graphic provided by: AdvancedGET. |
| |
| 5. Finally, the next cycle low is October 21st, almost suggesting that the Dow could experience an October retreat, which could be dramatic. September is usually the quietest month of the year, so it is possible that the Dow could move in a sideways pattern on low volume rising towards month end and into October. 6. Volume for the Dow has not been excessive, with few days where volume was greater than its 30-day moving average. |
| To conclude, the chart of the Dow is far more conservative than the chart of the OEX, but there is a suggestion that the Dow could rise to 10105, a rise of nearly 8% from present levels. |
Has been a technical analyst since 1969, and has worked as a futures and options trader with First Financial Futures in Johannesburg, South Africa.
| Address: | 3256 West 24th Ave |
| Vancouver, BC | |
| Phone # for sales: | 6042634214 |
| E-mail address: | petroosp@gmail.com |
Click here for more information about our publications!
Comments
Date: 08/26/03Rank: 5Comment:
Date: 08/27/03Rank: 3Comment:

Request Information From Our Sponsors
- StockCharts.com, Inc.
- Candle Patterns
- Candlestick Charting Explained
- Intermarket Technical Analysis
- John Murphy on Chart Analysis
- John Murphy's Chart Pattern Recognition
- John Murphy's Market Message
- MurphyExplainsMarketAnalysis-Intermarket Analysis
- MurphyExplainsMarketAnalysis-Visual Analysis
- StockCharts.com
- Technical Analysis of the Financial Markets
- The Visual Investor
- VectorVest, Inc.
- Executive Premier Workshop
- One-Day Options Course
- OptionsPro
- Retirement Income Workshop
- Sure-Fire Trading Systems (VectorVest, Inc.)
- Trading as a Business Workshop
- VectorVest 7 EOD
- VectorVest 7 RealTime/IntraDay
- VectorVest AutoTester
- VectorVest Educational Services
- VectorVest OnLine
- VectorVest Options Analyzer
- VectorVest ProGraphics v6.0
- VectorVest ProTrader 7
- VectorVest RealTime Derby Tool
- VectorVest Simulator
- VectorVest Variator
- VectorVest Watchdog
