HOT TOPICS LIST
- MACD
- Fibonacci
- RSI
- Gann
- ADXR
- Stochastics
- Volume
- Triangles
- Futures
- Cycles
- Volatility
- ZIGZAG
- MESA
- Retracement
- Aroon
INDICATORS LIST
LIST OF TOPICS
PRINT THIS ARTICLE
by Matt Blackman
After a Jeffries & Co. analyst issued a buy recommendation on Boston Communications in mid-July, news came out that the company was in danger of losing a major client. It plummeted 40% on the news and continued down in the following three weeks, losing more than 50% of its value. Now on the comeback trail, it appears that the stock may have been unfairly punished.
Position: N/A
Matt Blackman
Matt Blackman is a full-time technical and financial writer and trader. He produces corporate and financial newsletters, and assists clients in getting published in the mainstream media. He is the host of TradeSystemGuru.com. Matt has earned the Chartered Market Technician (CMT) designation. Find out what stocks and futures Matt is watching on Twitter at www.twitter.com/RatioTrade
PRINT THIS ARTICLE
TECHNICAL INDICATORS
Boston Communications Stock 40% Off Sale
08/21/03 08:31:47 AMby Matt Blackman
After a Jeffries & Co. analyst issued a buy recommendation on Boston Communications in mid-July, news came out that the company was in danger of losing a major client. It plummeted 40% on the news and continued down in the following three weeks, losing more than 50% of its value. Now on the comeback trail, it appears that the stock may have been unfairly punished.
Position: N/A
| It's an analyst's worst nightmare. On July 16th, Ben Abramovitz of Jeffries & Co. issued a "buy" recommendation on Boston Communications (BCGI). It had been trading in the low $20 range. His target was $26. The next day, the company announced that Verizon Wireless, which provides 50% of its revenues, was looking to provide its own in-house pre-paid card services, a service currently provided by Boston Communications In one day, the stock dropped 40% from $19.73 to $12.70. Over the next three weeks, it continued to drop, hitting a low of $10.39 on August 11. Since then, it has begun to recover, closing at $11.76 on August 22, the day after the big blackout. There are a number of reasons, both technical and fundamental, why this stock could be a good speculative recovery play. |
| Fundamental 1) As of August 8, more than 50% of the BCGI stock was held short. After hitting the low, shorts most certainly will have begun to cover providing upward impetus to stock price. 2) Quarterly earnings have nearly tripled in the last four quarters, from 8 to 22 cents a share. 3) Institutions hold ninety-five percent of the stock. With a float of 17 million shares, shorts could find buying more than eight million to cover a real challenge unless institutions decide to become major sellers. Either way, we have a potential short squeeze in the making. 4) The price now reflects the loss of Verizon Wireless as a client. However, since this is not a done deal, and if the contract is renewed later this year (a strong likelihood as Verizon is looking at the possibility of launching its own platform and still has to complete tests) look for a nice rebound. |

|
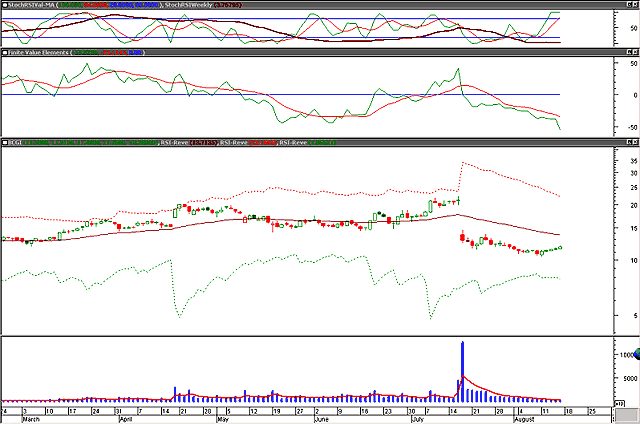
| Figure 1 – Daily chart of Boston Communications (BCGI) looking overbought but showing the beginnings of a comeback in price. The upper window is the nine-period stochasticRSI in overbought territory. The second window shows the 22-period Finite Value Elements (FVE) with a moving average. Watch for the green 22-period FVE line to cross above the MA to confirm a buying signal. The main window shows stock price with the re-engineered RSI 50 line straddled by the 70 sell line (red dashed line) on the upper side and 30 buy line (green dashed) on the lower side. A buy signal will be generated when the price crosses the brown 50 line. |
| Graphic provided by: MetaStock. |
| |
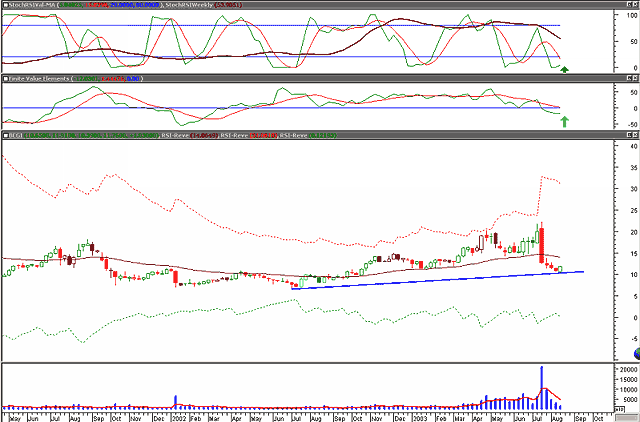
| Technical 1) As of August 15, the stock was overbought on the daily chart. However it is oversold on the weekly (see Figure 2). If the price to remains firm as the daily stochasticRSI indicator (Figure 1) returns to oversold territory, it will be a bullish signal. Both daily and weekly stochRSI will be in sync in oversold territory. 2) Watch for the Finite Value Elements (FVE) indicator to cross the MA on the daily and zero line on the weekly chart to confirm a buy signal. 3) A cross of the re-engineered RSI 50 (brown) line by price on the daily chart will confirm this. |
 Figure 2 - Weekly chart of BCGI showing the trendline on the price chart and potential upcoming buy signals in the two upper windows. The dark green arrow shows possible potential buy signal on the stochasticRSI and the light green arrow, the buy signal on the FVE. Markets continue to exhibit signs of bullish support. This is confirmed by the fact that the biggest power failure in U.S. history did little to dampen enthusiasm. Labor Day historically shows the biggest single day gains of any holiday throughout the year and it could be even bigger given the aimless meanderings that markets have shown in the last two months. Never short a dull market and markets have been exactly that since hitting highs in June. Sideways price channels and boring displays of market action are often an indication of accumulation. To sum up, there are both technical and fundamental reasons why BCGI may be a good speculative play but if so, the indicators will confirm. It's simply a matter of watching and waiting. Any breakout will be all the more powerful if supported by coinciding market strength. |
Matt Blackman is a full-time technical and financial writer and trader. He produces corporate and financial newsletters, and assists clients in getting published in the mainstream media. He is the host of TradeSystemGuru.com. Matt has earned the Chartered Market Technician (CMT) designation. Find out what stocks and futures Matt is watching on Twitter at www.twitter.com/RatioTrade
| Company: | TradeSystemGuru.com |
| Address: | Box 2589 |
| Garibaldi Highlands, BC Canada | |
| Phone # for sales: | 604-898-9069 |
| Fax: | 604-898-9069 |
| Website: | www.tradesystemguru.com |
| E-mail address: | indextradermb@gmail.com |
Traders' Resource Links | |
| TradeSystemGuru.com has not added any product or service information to TRADERS' RESOURCE. | |
Click here for more information about our publications!
Comments
Date: 08/21/03Rank: 4Comment:

|

Request Information From Our Sponsors
- StockCharts.com, Inc.
- Candle Patterns
- Candlestick Charting Explained
- Intermarket Technical Analysis
- John Murphy on Chart Analysis
- John Murphy's Chart Pattern Recognition
- John Murphy's Market Message
- MurphyExplainsMarketAnalysis-Intermarket Analysis
- MurphyExplainsMarketAnalysis-Visual Analysis
- StockCharts.com
- Technical Analysis of the Financial Markets
- The Visual Investor
- VectorVest, Inc.
- Executive Premier Workshop
- One-Day Options Course
- OptionsPro
- Retirement Income Workshop
- Sure-Fire Trading Systems (VectorVest, Inc.)
- Trading as a Business Workshop
- VectorVest 7 EOD
- VectorVest 7 RealTime/IntraDay
- VectorVest AutoTester
- VectorVest Educational Services
- VectorVest OnLine
- VectorVest Options Analyzer
- VectorVest ProGraphics v6.0
- VectorVest ProTrader 7
- VectorVest RealTime Derby Tool
- VectorVest Simulator
- VectorVest Variator
- VectorVest Watchdog
