HOT TOPICS LIST
- MACD
- Fibonacci
- RSI
- Gann
- ADXR
- Stochastics
- Volume
- Triangles
- Futures
- Cycles
- Volatility
- ZIGZAG
- MESA
- Retracement
- Aroon
INDICATORS LIST
LIST OF TOPICS
PRINT THIS ARTICLE
by Gary Grosschadl
Altera's daily chart looks bullish with a possible ascending triangle but the weekly chart shows bearish possibilites.
Position: Hold
Gary Grosschadl
Independent Canadian equities trader and technical analyst based in Peterborough
Ontario, Canada.
PRINT THIS ARTICLE
MOVING AVERAGES
Altera Corporation Looks Weak On A Weekly Basis
08/15/03 01:54:18 PMby Gary Grosschadl
Altera's daily chart looks bullish with a possible ascending triangle but the weekly chart shows bearish possibilites.
Position: Hold
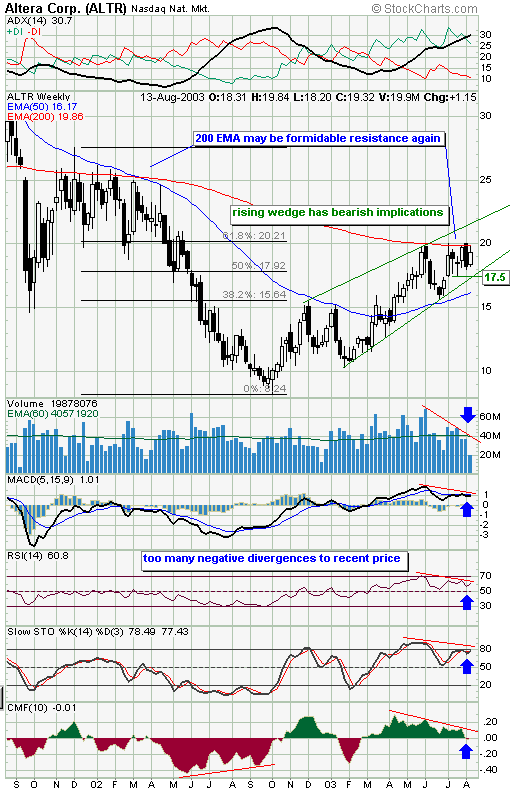
| On Altera's weekly chart the moving averages (in this case the exponential) tell the story. When the stock broke the 200-period moving average support back in October 2001, it suffered all the way down from $20 to $8.24. Those that took heed of another bearish signal, namely the crossing of the 50-week EMA through the 200-week EMA, were well served. The trend finally turned up when the stock managed to close above the 50-week EMA after failing twice before. |
| Although an uptrend has been established by virtue of higher highs and higher lows, several warning signs are emerging. The obvious one being that this stock's old nemesis is back - the 200-period EMA. The chart shows several failed recent attempts to close above this formidable resistance line. |

|
| ALTR's weekly chart showing two important moving averages. |
| Graphic provided by: Stockcharts.com. |
| |
| A strong indication that Altera may fail again and also perhaps begin a downleg are the multiple negative divergences to recent price action as illustrated. The volume divergence shows not enough conviction by the bulls to move it higher. At the same time several oscillators are also showing the same divergence problem. Finally the Chaiken money flow indicator shows a worsening supply and demand relationship. Again there is less conviction by buyers as the stock has been rising. This is often an important red flag showing that all is not well with the rising formation. This gels with the pattern shown on the chart - a bearish rising wedge. |
| The stock may continue higher until a more definite sign of pattern failure comes about, that being a move below the lower wedge trendline. This may coincide with the recent short-term support line drawn at $17.50. A move below is bearish but a bounce (or temporary support) off the nearby 50-period moving average is something to watch for. This may set up a re-test of that trendline and another possible failure with shorting possibilities. |
| In summary, the way further north may not be given the final thumbs up until the 50 and 200 EMAs cross again. The cross on the way down was very telling, the same cross or failure to cross may also turn out to be another noteable turning point for this stock. |
Independent Canadian equities trader and technical analyst based in Peterborough
Ontario, Canada.
| Website: | www.whatsonsale.ca/financial.html |
| E-mail address: | gwg7@sympatico.ca |
Click here for more information about our publications!
Comments

|

Request Information From Our Sponsors
- StockCharts.com, Inc.
- Candle Patterns
- Candlestick Charting Explained
- Intermarket Technical Analysis
- John Murphy on Chart Analysis
- John Murphy's Chart Pattern Recognition
- John Murphy's Market Message
- MurphyExplainsMarketAnalysis-Intermarket Analysis
- MurphyExplainsMarketAnalysis-Visual Analysis
- StockCharts.com
- Technical Analysis of the Financial Markets
- The Visual Investor
- VectorVest, Inc.
- Executive Premier Workshop
- One-Day Options Course
- OptionsPro
- Retirement Income Workshop
- Sure-Fire Trading Systems (VectorVest, Inc.)
- Trading as a Business Workshop
- VectorVest 7 EOD
- VectorVest 7 RealTime/IntraDay
- VectorVest AutoTester
- VectorVest Educational Services
- VectorVest OnLine
- VectorVest Options Analyzer
- VectorVest ProGraphics v6.0
- VectorVest ProTrader 7
- VectorVest RealTime Derby Tool
- VectorVest Simulator
- VectorVest Variator
- VectorVest Watchdog
