HOT TOPICS LIST
- MACD
- Fibonacci
- RSI
- Gann
- ADXR
- Stochastics
- Volume
- Triangles
- Futures
- Cycles
- Volatility
- ZIGZAG
- MESA
- Retracement
- Aroon
INDICATORS LIST
LIST OF TOPICS
PRINT THIS ARTICLE
by David Penn
After a vertigo-inducing rally in early June, an island reversal threatens to send October cotton futures from whence they came.
Position: N/A
David Penn
Technical Writer for Technical Analysis of STOCKS & COMMODITIES magazine, Working-Money.com, and Traders.com Advantage.
PRINT THIS ARTICLE
ISLAND REVERSAL
October Cotton's Island Top
08/18/03 08:22:31 AMby David Penn
After a vertigo-inducing rally in early June, an island reversal threatens to send October cotton futures from whence they came.
Position: N/A
| Those investors and long-term traders who have been looking to make money on cotton futures have got to be close to throwing in the towel. Basis continuous futures, cotton has been trading in a range between 64 and 50 since putting in a bottom back in October 2001. In fact, while cotton futures have retreated to 50 (or thereabouts) three times since the fall of 2001 and have each time rallied from these levels (if only to top out before clearing 65), this back and forth has been of little benefit to anyone who didn't realize that cotton was more likely to oscillate than to break out over the past few years. |
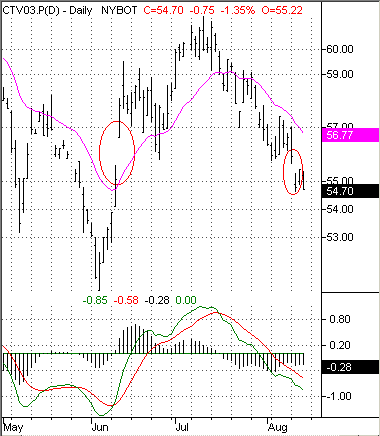
| It is in this context that the looming breakdown in cotton futures is perhaps best understood. After rallying from a low of about 51.20 in early June, cotton futures climbed ten cents before peaking out at 61.30 in July. The failure of cotton bulls to take prices higher -- to, say, the penny-higher high of April 2003 -- apparently emboldened the bears who promptly sold cotton back into the mid-50s by the beginning of August. |

|
| Does this island top point toward a retest of October cotton's early June lows? |
| Graphic provided by: TradeStation. |
| |
| The summertime rise and fall of cotton futures appears to have traced out an island top, a bearish reversal pattern characterized by a rally, a gap up, a consolidation often with a rounded peak, followed by a decline and a gap down -- usually at approximately the same level as the gap up. In his book, Encyclopedia of Chart Patterns, Thomas Bulkowski is less than enthusiastic about the fortunes of island tops and bottoms, largely because he believes that they provide for limited post-break price moves (even if he believe that the failure rate for tops -- 13% is "quite good"). Nevertheless, considering the way cotton has traded since the fall of 2001, any technical pattern that suggests that cotton might do what it has been doing for the past several months of oscillating between 65 and 50 may be more worthy of consideration than might ordinarily (per Bulkowski) be the case. |
| What sort of price action going forward can cotton traders expect if the island top turns out to be a valid reversal sign? Most immediately, the question is whether or not October cotton will return to retest the lows of early June. And calling upon the measurement rule for island tops suggests that just such a test is likely. The measurement rule for island tops involves subtracting the formation size from the value at the bottom of the pattern. Here, a formation size of roughly 5 (61-56) subtracted from the value at the bottom of the pattern gives a downside projection of 51, which makes another confrontation with lows that have remained intact since the fall of 2001 the most probable outcome in the near-term. |
Technical Writer for Technical Analysis of STOCKS & COMMODITIES magazine, Working-Money.com, and Traders.com Advantage.
| Title: | Technical Writer |
| Company: | Technical Analysis, Inc. |
| Address: | 4757 California Avenue SW |
| Seattle, WA 98116 | |
| Phone # for sales: | 206 938 0570 |
| Fax: | 206 938 1307 |
| Website: | www.Traders.com |
| E-mail address: | DPenn@traders.com |
Traders' Resource Links | |
| Charting the Stock Market: The Wyckoff Method -- Books | |
| Working-Money.com -- Online Trading Services | |
| Traders.com Advantage -- Online Trading Services | |
| Technical Analysis of Stocks & Commodities -- Publications and Newsletters | |
| Working Money, at Working-Money.com -- Publications and Newsletters | |
| Traders.com Advantage -- Publications and Newsletters | |
| Professional Traders Starter Kit -- Software | |
Click here for more information about our publications!
PRINT THIS ARTICLE

Request Information From Our Sponsors
- StockCharts.com, Inc.
- Candle Patterns
- Candlestick Charting Explained
- Intermarket Technical Analysis
- John Murphy on Chart Analysis
- John Murphy's Chart Pattern Recognition
- John Murphy's Market Message
- MurphyExplainsMarketAnalysis-Intermarket Analysis
- MurphyExplainsMarketAnalysis-Visual Analysis
- StockCharts.com
- Technical Analysis of the Financial Markets
- The Visual Investor
- VectorVest, Inc.
- Executive Premier Workshop
- One-Day Options Course
- OptionsPro
- Retirement Income Workshop
- Sure-Fire Trading Systems (VectorVest, Inc.)
- Trading as a Business Workshop
- VectorVest 7 EOD
- VectorVest 7 RealTime/IntraDay
- VectorVest AutoTester
- VectorVest Educational Services
- VectorVest OnLine
- VectorVest Options Analyzer
- VectorVest ProGraphics v6.0
- VectorVest ProTrader 7
- VectorVest RealTime Derby Tool
- VectorVest Simulator
- VectorVest Variator
- VectorVest Watchdog
