HOT TOPICS LIST
- MACD
- Fibonacci
- RSI
- Gann
- ADXR
- Stochastics
- Volume
- Triangles
- Futures
- Cycles
- Volatility
- ZIGZAG
- MESA
- Retracement
- Aroon
INDICATORS LIST
LIST OF TOPICS
PRINT THIS ARTICLE
by David Penn
Rallies from July lows take the form of gaps in September beans and corn.
Position: N/A
David Penn
Technical Writer for Technical Analysis of STOCKS & COMMODITIES magazine, Working-Money.com, and Traders.com Advantage.
PRINT THIS ARTICLE
GAPS
Grains Gone Wild
08/15/03 08:46:32 AMby David Penn
Rallies from July lows take the form of gaps in September beans and corn.
Position: N/A
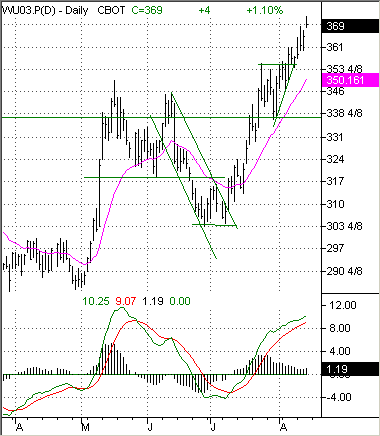
| The breakdown from the double top in September wheat that I wrote about back in June ("An Intermediate Double Top in September Wheat," Traders.com Advantage, June 26, 2003), failed to reach its downside objective. Breaking down at 318 in mid-June, September wheat fell as low as 304 by month's end and, after a small bounce and retest of the low at 304 in early July, began moving up steadily over the course of the summer. Rather than setting a new contract low -- as my downside projection had suggested -- September wheat was trading above the high point of the double top by mid-July, approximately a month after prices broke down. |

|
| Figure 1: Wheat futures broke down in mid-June, but were actually trading higher one month later. |
| Graphic provided by: TradeStation. |
| |
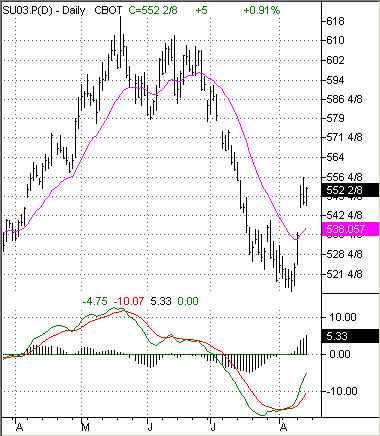
More recently, wheat has enjoyed a breakout from an ascending triangle that developed at the end of July and into August. This continuation formation, which measured approximately 15 points, pointed to an upside of about 368 or so, which September wheat reached in a gap up move in mid-August. Figure 2: The downside objective for the double top in September soybeans was met and exceeded by the declines of July. But does the sudden move off the lows mean that soybeans are done going down? But some of the more dramatic moves in the grains may come from soybeans and corn, both of which were in clear downtrends for most of the summer. September beans broke down from a double top-like top on a gap down early in July, falling some 60 points from 581 to 521 before putting in a bottom. Mid-August, however, has soybeans moving up somewhat -- starting with a strong move off the lows and a subsequent gap up over the 20-day exponential moving average (EMA). While this is a sharp move -- and the gap up a strong indicator of higher prices in the near-term -- those looking to go long soybeans may want to be wary of the gap in mid-August swiftly closing, even if higher prices for soybeans are likely further down the road. |
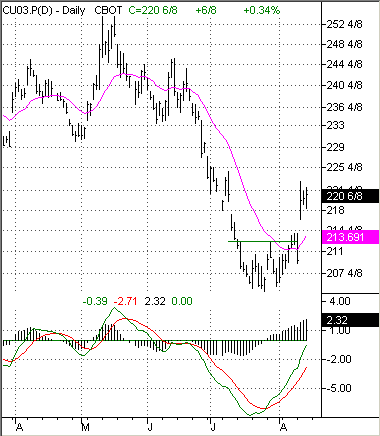
 Figure 3: Like soybeans, September corn has put in a bottom in late July/early August and rallied strongly off those lows by way of a gap. September corn looks to be following the soybean script to this point. Corn broke down in late June, before soybeans, but roughly around the same time as the wheat breakdown. Like soybeans, corn spent most of July in a fairly straightforward decline, falling from about 234 to under 207. The rally from the July-August lows in corn has been almost the spitting image of the soybean rally -- a strong up move followed by a gap up and then a few days of consolidation -- and it isn't a stretch at this point for those watching the grains to want to see corn and soybeans continue to confirm each others price action going forward. |
| Is there any way of determining whether or not the sharp moves off the lows in corn and soybeans -- as well as the currently bullish character of wheat -- will be long-lasting new trends? Long-term charts of wheat and corn seem to suggest that, at a minimum, both commodities are responding technically to exceptionally oversold conditions. Basis continuous futures, both wheat and corn are rallying from spring/summer lows in 2003 that were truly historic; until proven otherwise, both commodities are still correcting from highs reached back in the mid-1990s. Soybeans (again, basis continuous futures) may have put in their long-term bottom a year earlier at the beginning of 2002 and may be "ahead of schedule" for grains. As such, grain traders should be vigilant to the possibility of bullish leadership -- however short in duration -- switching from soybeans to wheat and/or corn going forward. |
Technical Writer for Technical Analysis of STOCKS & COMMODITIES magazine, Working-Money.com, and Traders.com Advantage.
| Title: | Technical Writer |
| Company: | Technical Analysis, Inc. |
| Address: | 4757 California Avenue SW |
| Seattle, WA 98116 | |
| Phone # for sales: | 206 938 0570 |
| Fax: | 206 938 1307 |
| Website: | www.Traders.com |
| E-mail address: | DPenn@traders.com |
Traders' Resource Links | |
| Charting the Stock Market: The Wyckoff Method -- Books | |
| Working-Money.com -- Online Trading Services | |
| Traders.com Advantage -- Online Trading Services | |
| Technical Analysis of Stocks & Commodities -- Publications and Newsletters | |
| Working Money, at Working-Money.com -- Publications and Newsletters | |
| Traders.com Advantage -- Publications and Newsletters | |
| Professional Traders Starter Kit -- Software | |
Click here for more information about our publications!
PRINT THIS ARTICLE

Request Information From Our Sponsors
- StockCharts.com, Inc.
- Candle Patterns
- Candlestick Charting Explained
- Intermarket Technical Analysis
- John Murphy on Chart Analysis
- John Murphy's Chart Pattern Recognition
- John Murphy's Market Message
- MurphyExplainsMarketAnalysis-Intermarket Analysis
- MurphyExplainsMarketAnalysis-Visual Analysis
- StockCharts.com
- Technical Analysis of the Financial Markets
- The Visual Investor
- VectorVest, Inc.
- Executive Premier Workshop
- One-Day Options Course
- OptionsPro
- Retirement Income Workshop
- Sure-Fire Trading Systems (VectorVest, Inc.)
- Trading as a Business Workshop
- VectorVest 7 EOD
- VectorVest 7 RealTime/IntraDay
- VectorVest AutoTester
- VectorVest Educational Services
- VectorVest OnLine
- VectorVest Options Analyzer
- VectorVest ProGraphics v6.0
- VectorVest ProTrader 7
- VectorVest RealTime Derby Tool
- VectorVest Simulator
- VectorVest Variator
- VectorVest Watchdog
