HOT TOPICS LIST
- MACD
- Fibonacci
- RSI
- Gann
- ADXR
- Stochastics
- Volume
- Triangles
- Futures
- Cycles
- Volatility
- ZIGZAG
- MESA
- Retracement
- Aroon
INDICATORS LIST
LIST OF TOPICS
PRINT THIS ARTICLE
by Kevin Hopson
The Oil Services Index recently put in a short-term bottom but the jury is still out as to whether or not the group can move higher.
Position: Hold
Kevin Hopson
Kevin has been a technical analyst for roughly 10 years now. Previously, Kevin owned his own business and acted as a registered investment advisor, specializing in energy. He was also a freelance oil analyst for Orient Trading Co., a commodity futures trading firm in Japan. Kevin is currently a freelance writer.
PRINT THIS ARTICLE
TECHNICAL ANALYSIS
Oil Services Index Bumping Up Against Key Resistance
08/14/03 08:19:38 AMby Kevin Hopson
The Oil Services Index recently put in a short-term bottom but the jury is still out as to whether or not the group can move higher.
Position: Hold
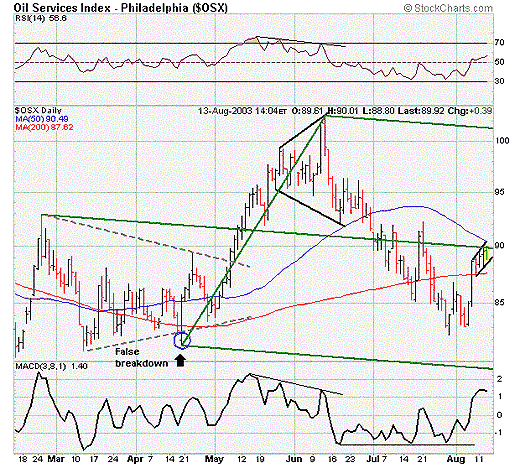
| The last time I talked about the Oil Services Index (OSX), I touched on the fact that we were seeing bullish divergences on the chart. For example, the relative strength index (RSI) and moving average convergence/divergence (MACD) were putting in double and triple bottoms, respectively, despite a continuous decline in the index. As a result, I believed that a short-term bottom was being put in. However, I also said that the index had to do three things to confirm this. More specifically, the index had to close above its 200-day moving average, the RSI had to move above 50 and the MACD had to cross above zero. As you can see, all three of these things occurred, confirming my prediction of a bottom reversal. |
| Unfortunately, the index is now brushing up against key resistance. For example, notice how the green median line and the 50-day moving average are both converging around the 90 level. Additionally, the 38.2 percent retracement level from the June-July decline comes in right above 90, thus creating a confluence of resistance around this level. Furthermore, the index has formed a bearish flag, which is basically a steep run-up (flag pole) followed by a rising channel (flag). Since prices tend to break in the opposite direction of a flag formation, and taking into account current overhead resistance, the OSX could be setting up for a decline in the near-term. |

|
| Graphic provided by: Stockcharts.com. |
| |
| Also worth noting is the spring rally. For example, notice how the OSX broke out of a bullish triangle back in May. Triangle formations often develop before the final move of a trend. Since the trend was positive leading up to the triangle formation, May's breakout could have signaled the final thrust in the index's long-term uptrend. You will also notice the bearish divergences on the chart (declining RSI and MACD) and the expanding triangle formation from late May to mid-June. These tend to be confirming indicators of a significant top. As a result, in the bigger scheme of things, we may have already seen the ultimate top in the index. In other words, the recent bounce may only be a correction in the current downtrend, meaning that it will take an authoritative move above the 90 level for the longer-term technicals to turn bullish. |
Kevin has been a technical analyst for roughly 10 years now. Previously, Kevin owned his own business and acted as a registered investment advisor, specializing in energy. He was also a freelance oil analyst for Orient Trading Co., a commodity futures trading firm in Japan. Kevin is currently a freelance writer.
| Glen Allen, VA | |
| E-mail address: | hopson_1@yahoo.com |
Click here for more information about our publications!
Comments

Request Information From Our Sponsors
- StockCharts.com, Inc.
- Candle Patterns
- Candlestick Charting Explained
- Intermarket Technical Analysis
- John Murphy on Chart Analysis
- John Murphy's Chart Pattern Recognition
- John Murphy's Market Message
- MurphyExplainsMarketAnalysis-Intermarket Analysis
- MurphyExplainsMarketAnalysis-Visual Analysis
- StockCharts.com
- Technical Analysis of the Financial Markets
- The Visual Investor
- VectorVest, Inc.
- Executive Premier Workshop
- One-Day Options Course
- OptionsPro
- Retirement Income Workshop
- Sure-Fire Trading Systems (VectorVest, Inc.)
- Trading as a Business Workshop
- VectorVest 7 EOD
- VectorVest 7 RealTime/IntraDay
- VectorVest AutoTester
- VectorVest Educational Services
- VectorVest OnLine
- VectorVest Options Analyzer
- VectorVest ProGraphics v6.0
- VectorVest ProTrader 7
- VectorVest RealTime Derby Tool
- VectorVest Simulator
- VectorVest Variator
- VectorVest Watchdog
