HOT TOPICS LIST
- MACD
- Fibonacci
- RSI
- Gann
- ADXR
- Stochastics
- Volume
- Triangles
- Futures
- Cycles
- Volatility
- ZIGZAG
- MESA
- Retracement
- Aroon
INDICATORS LIST
LIST OF TOPICS
PRINT THIS ARTICLE
by David Penn
A positive divergence between the MACD indicator and the greenback/yen pair provides an intraday buying opportunity.
Position: N/A
David Penn
Technical Writer for Technical Analysis of STOCKS & COMMODITIES magazine, Working-Money.com, and Traders.com Advantage.
PRINT THIS ARTICLE
DOUBLE BOTTOMS
An Intraday Double Bottom In USD/JPY
08/12/03 01:53:49 PMby David Penn
A positive divergence between the MACD indicator and the greenback/yen pair provides an intraday buying opportunity.
Position: N/A
| The combination of volatility and leverage makes trading the Japanese yen more than a little intimidating than trading many other common, international currencies. While it is true that currencies in general trend better than most other trading vehicles, the Japanese yen is often an outlier on that trend of trendiness. Arguably, and particularly of late, the level of intervention the Japanese central bank has exerted in the currency markets has contributed greatly to the volatility of that nation's currency. |
| That said, the volatility in the Japanese yen can be less of a problem in shorter-time frames, such as hourly charts, when short-term trends can develop, mature and end in the context of what might appear on a daily chart to be merely the sort of high-intensity zig-zagging that is more common to polygraph tests of guilty suspects than of instruments prudent traders would feel comfortable associating with. |

|
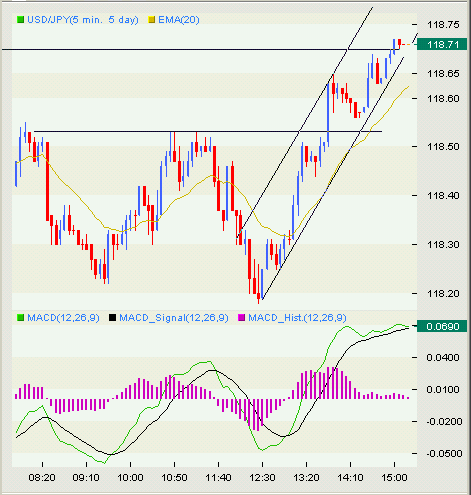
| Figure 1: Compare the two troughs in the USD/JPY at approximately 9:35 and 12:30 to the troughs in the MACD at the same time. This positive divergence led prices higher and anticipated a successful breakout above 118.50 by 14:00 (2:00 p.m.) |
| Graphic provided by: FXCM. |
| |
| Here, I was watching the USD/JPY as it made a lower trough near mid-day Eastern time. One entry set-up that I have been using as a tool for studying intraday forex is Dave Landry's 2/20 EMA breakout system, which he presented in Technical Analysis of Stocks and Commodities magazine back in December 1996. Essentially, Landry's system looks for confirmation (by way of a follow-through bar) of a breakout based on price action around the 20-period exponential moving average. Whether or not a trader decides to actually use the 2/20 EMA breakout as a trading system, the 2/20 EMA breakout system is helpful at a minimum in determining when new trends appear to be developing. |
| What caught my eye, however, was the positive MACD divergence after the USD/JPY made a lower low. Recall that a positive divergence comes when an indicator points toward a bullish development, while price action remains bearish. In this instance, the fact that the second MACD trough was higher than the first one sets up a positive divergence compared to the two troughs in the USD/JPY, which show a lower low in the second trough. A Landry 2/20 EMA breakout occurs shortly after prices rebound from the second trough and the rally is on. |
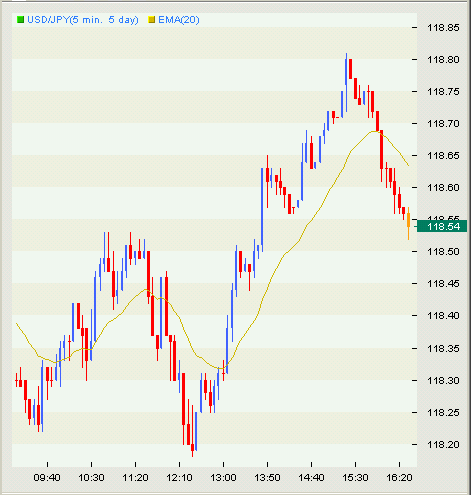
 Figure 2: After reaching its price projection level of 118.80 near the bottom of the 15:00 hour (around 3:30 p.m.), the USD/JPY reversed and fell sharply back toward the breakout level around 118.50. This is also an example of how combining technical strategies can help make winning trades. Landry's 2/20 EMA breakout would have a trader long near 118.45, but the trader would not necessarily know whether or not it made sense to take quick profits as USD/JPY approached resistance just north of 118.50 or to stick it out for larger gains. The combination of the double bottom and the positive MACD divergence would have signaled that there was likely more upside beyond 118.50. In fact, the double bottom anticipated a move to the 118.80 area -- given the 30 pip size of the formation and a breakout level at roughly 118.50. As Figure 2 shows, this projection was exactly correct, as prices touched 118.80 briefly before correcting sharply. |
Technical Writer for Technical Analysis of STOCKS & COMMODITIES magazine, Working-Money.com, and Traders.com Advantage.
| Title: | Technical Writer |
| Company: | Technical Analysis, Inc. |
| Address: | 4757 California Avenue SW |
| Seattle, WA 98116 | |
| Phone # for sales: | 206 938 0570 |
| Fax: | 206 938 1307 |
| Website: | www.Traders.com |
| E-mail address: | DPenn@traders.com |
Traders' Resource Links | |
| Charting the Stock Market: The Wyckoff Method -- Books | |
| Working-Money.com -- Online Trading Services | |
| Traders.com Advantage -- Online Trading Services | |
| Technical Analysis of Stocks & Commodities -- Publications and Newsletters | |
| Working Money, at Working-Money.com -- Publications and Newsletters | |
| Traders.com Advantage -- Publications and Newsletters | |
| Professional Traders Starter Kit -- Software | |
Click here for more information about our publications!
Comments
Date: 08/14/03Rank: 4Comment:
Date: 08/24/03Rank: Comment: I never trade before I will be very happy if you advise me how to start
Date: 08/30/03Rank: 5Comment:

Request Information From Our Sponsors
- VectorVest, Inc.
- Executive Premier Workshop
- One-Day Options Course
- OptionsPro
- Retirement Income Workshop
- Sure-Fire Trading Systems (VectorVest, Inc.)
- Trading as a Business Workshop
- VectorVest 7 EOD
- VectorVest 7 RealTime/IntraDay
- VectorVest AutoTester
- VectorVest Educational Services
- VectorVest OnLine
- VectorVest Options Analyzer
- VectorVest ProGraphics v6.0
- VectorVest ProTrader 7
- VectorVest RealTime Derby Tool
- VectorVest Simulator
- VectorVest Variator
- VectorVest Watchdog
- StockCharts.com, Inc.
- Candle Patterns
- Candlestick Charting Explained
- Intermarket Technical Analysis
- John Murphy on Chart Analysis
- John Murphy's Chart Pattern Recognition
- John Murphy's Market Message
- MurphyExplainsMarketAnalysis-Intermarket Analysis
- MurphyExplainsMarketAnalysis-Visual Analysis
- StockCharts.com
- Technical Analysis of the Financial Markets
- The Visual Investor
