HOT TOPICS LIST
- MACD
- Fibonacci
- RSI
- Gann
- ADXR
- Stochastics
- Volume
- Triangles
- Futures
- Cycles
- Volatility
- ZIGZAG
- MESA
- Retracement
- Aroon
INDICATORS LIST
LIST OF TOPICS
PRINT THIS ARTICLE
by Gary Grosschadl
The world's largest supplier of methanol is engaged in an important trendline test on its weekly chart.
Position: Hold
Gary Grosschadl
Independent Canadian equities trader and technical analyst based in Peterborough
Ontario, Canada.
PRINT THIS ARTICLE
CHART ANALYSIS
Methanex Corporation's Prospects
08/12/03 12:04:40 PMby Gary Grosschadl
The world's largest supplier of methanol is engaged in an important trendline test on its weekly chart.
Position: Hold
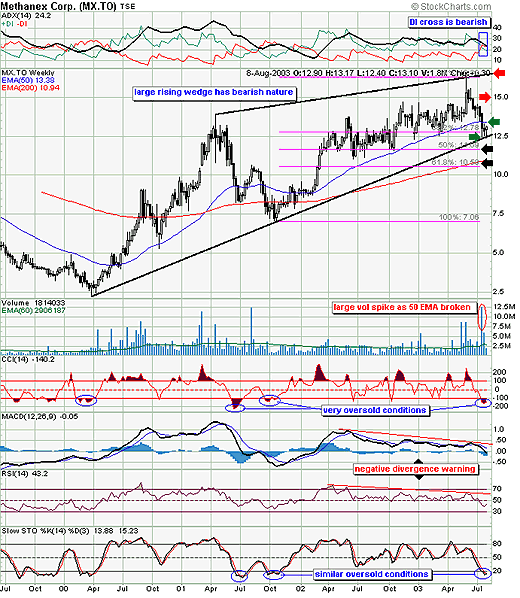
| The weekly 3-year chart shows a large bearish wedge formation. The chart looks as if it is setting up for a bounce off of their long-term lower trendline. The long lower tails of the last three weeks hint at a bottom forming here and also have the appearance of a tweezer bottom. |
| Although it is tempting to call for a bounce off this trendline, it is more prudent to wait for further proof either way. The green arrows show the immediate support and resistance to beat in the short term. An upside break is likely with a move past 50-period EMA resistance currently at 13.38. Note how well this line has held previous support and how the volume surged as this recent support gave way. This could be an important resistance line going forward and would indicate bullishness if beaten. The lower green arrow shows the more recent support area of 12.40. If this tweezer bottom area fails to hold then more downside is in store. |

|
| Methanex's weekly chart showing the long-term trendline test. |
| Graphic provided by: Stockcharts.com. |
| |
| Several indicators are worth noting. At the top of the chart the directional movement indicator is flashing a bearish signal with a recent DI cross. As the ADX component weakened, the previous bull trend reversed as witnessed by bullish power (+DI) descending while bearish power (-DI) ascended, giving way to this bearish crossing. The stochastics oscillator and the CCI (commodity channel index) show very oversold levels which hint at the bounce potential here. Note how the other two indicators warned of the current downtrend via their negative divergences to price action. |
| When clearer direction unfolds with a move past either green arrow, some upside and downside targets are marked. The lower targets match Fibonacci levels of 50% at 11.69 or stronger support at 10.50, being the 61.8% level. The range chosen for the upper and lower threshholds are the two last major pivot points, as opposed to using the low of the chart. Note the 200-period EMA at 10.94 which could also act as strong support. The upper targets are the previous congestion area at $15 and the upper trendline resistance which is around $16.50. |
| In summary, the next major move may be dictated by either a bullish move past the 50-period EMA or a breakdown of the bearish wedge. I am leaning towards a bullish push north (delaying the wedge breakdown bias) but it is more prudent to let the market tip its hand first. |
Independent Canadian equities trader and technical analyst based in Peterborough
Ontario, Canada.
| Website: | www.whatsonsale.ca/financial.html |
| E-mail address: | gwg7@sympatico.ca |
Click here for more information about our publications!
Comments
Date: 08/13/03Rank: 4Comment:
Date: 08/19/03Rank: 5Comment:

Request Information From Our Sponsors
- StockCharts.com, Inc.
- Candle Patterns
- Candlestick Charting Explained
- Intermarket Technical Analysis
- John Murphy on Chart Analysis
- John Murphy's Chart Pattern Recognition
- John Murphy's Market Message
- MurphyExplainsMarketAnalysis-Intermarket Analysis
- MurphyExplainsMarketAnalysis-Visual Analysis
- StockCharts.com
- Technical Analysis of the Financial Markets
- The Visual Investor
- VectorVest, Inc.
- Executive Premier Workshop
- One-Day Options Course
- OptionsPro
- Retirement Income Workshop
- Sure-Fire Trading Systems (VectorVest, Inc.)
- Trading as a Business Workshop
- VectorVest 7 EOD
- VectorVest 7 RealTime/IntraDay
- VectorVest AutoTester
- VectorVest Educational Services
- VectorVest OnLine
- VectorVest Options Analyzer
- VectorVest ProGraphics v6.0
- VectorVest ProTrader 7
- VectorVest RealTime Derby Tool
- VectorVest Simulator
- VectorVest Variator
- VectorVest Watchdog
