HOT TOPICS LIST
- MACD
- Fibonacci
- RSI
- Gann
- ADXR
- Stochastics
- Volume
- Triangles
- Futures
- Cycles
- Volatility
- ZIGZAG
- MESA
- Retracement
- Aroon
INDICATORS LIST
LIST OF TOPICS
PRINT THIS ARTICLE
by Kevin Hopson
Swift Energy is showing signs of strength, indicating a potential break to the upside from the stock's two-month trading range.
Position: Accumulate
Kevin Hopson
Kevin has been a technical analyst for roughly 10 years now. Previously, Kevin owned his own business and acted as a registered investment advisor, specializing in energy. He was also a freelance oil analyst for Orient Trading Co., a commodity futures trading firm in Japan. Kevin is currently a freelance writer.
PRINT THIS ARTICLE
TECHNICAL ANALYSIS
Swift Energy Showing Signs Of Strength
08/11/03 08:16:30 AMby Kevin Hopson
Swift Energy is showing signs of strength, indicating a potential break to the upside from the stock's two-month trading range.
Position: Accumulate
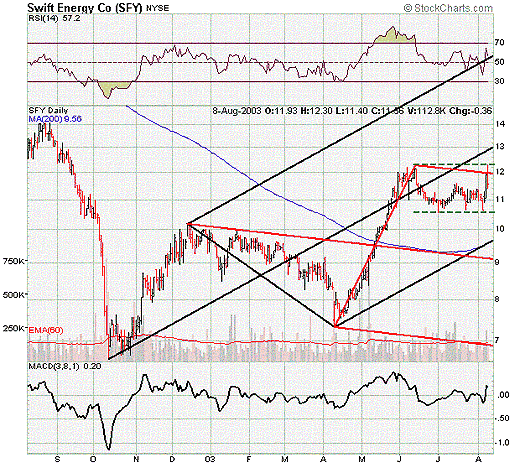
| Swift Energy Co. (SFY) is an oil and gas exploration and production company with primary operations in Louisiana, Texas and New Zealand. Technically speaking, the stock has been stuck in a trading range since mid-June. More specifically, the $12.30 level continues to act as resistance, while the $10.60 level continues to put a floor under prices. Since trading ranges tend to be continuation patterns and the current trend is up, I believe Swift Energy could see a further break to the upside. If Swift were to break to the upside in the near-term, the trading range indicates an initial price target of $14.00, which also coincides with last August's high. |
| Another sign of strength is the red pitchfork. For example, notice how the stock price failed to test the red median line on the recent pull back. Instead, Swift made its way back towards the top parallel line, breaching this trendline on an intraday basis late last week. This is usually a sign of strength and indicates a potential break to the upside in the near future. If this holds true, the $13.00 level - site of the black median line - should only act as temporary resistance before prices move higher. |

|
| Graphic provided by: Stockcharts.com. |
| |
| Another thing worth noting is market sentiment towards the stock. For example, seven of the 11 analysts covering Swift Energy currently have a "hold" or "sell" rating on the stock. Additionally, short interest -- though down slightly from June -- remains high. More specifically, there were over 1.0M shares short as of July 8, meaning that it would take roughly 6.3 days for shorts to cover their positions (based on the stock's average daily volume). With the technicals continuing to show strength and overly pessimistic market sentiment indicating potential buying pressure down the road, I would look to accumulate shares of Swift Energy on any near-term weakness. |
Kevin has been a technical analyst for roughly 10 years now. Previously, Kevin owned his own business and acted as a registered investment advisor, specializing in energy. He was also a freelance oil analyst for Orient Trading Co., a commodity futures trading firm in Japan. Kevin is currently a freelance writer.
| Glen Allen, VA | |
| E-mail address: | hopson_1@yahoo.com |
Click here for more information about our publications!
PRINT THIS ARTICLE

Request Information From Our Sponsors
- StockCharts.com, Inc.
- Candle Patterns
- Candlestick Charting Explained
- Intermarket Technical Analysis
- John Murphy on Chart Analysis
- John Murphy's Chart Pattern Recognition
- John Murphy's Market Message
- MurphyExplainsMarketAnalysis-Intermarket Analysis
- MurphyExplainsMarketAnalysis-Visual Analysis
- StockCharts.com
- Technical Analysis of the Financial Markets
- The Visual Investor
- VectorVest, Inc.
- Executive Premier Workshop
- One-Day Options Course
- OptionsPro
- Retirement Income Workshop
- Sure-Fire Trading Systems (VectorVest, Inc.)
- Trading as a Business Workshop
- VectorVest 7 EOD
- VectorVest 7 RealTime/IntraDay
- VectorVest AutoTester
- VectorVest Educational Services
- VectorVest OnLine
- VectorVest Options Analyzer
- VectorVest ProGraphics v6.0
- VectorVest ProTrader 7
- VectorVest RealTime Derby Tool
- VectorVest Simulator
- VectorVest Variator
- VectorVest Watchdog
