

HOT TOPICS LIST
- MACD
- Fibonacci
- RSI
- Gann
- ADXR
- Stochastics
- Volume
- Triangles
- Futures
- Cycles
- Volatility
- ZIGZAG
- MESA
- Retracement
- Aroon
INDICATORS LIST
LIST OF TOPICS
PRINT THIS ARTICLE
by Gary Grosschadl
This electricity supplier based in Houston is trying to turn up the juice.
Position: Hold
Gary Grosschadl
Independent Canadian equities trader and technical analyst based in Peterborough
Ontario, Canada.
PRINT THIS ARTICLE
CHART ANALYSIS
Reliant Resources Trying A Bounce
08/11/03 10:34:45 AMby Gary Grosschadl
This electricity supplier based in Houston is trying to turn up the juice.
Position: Hold
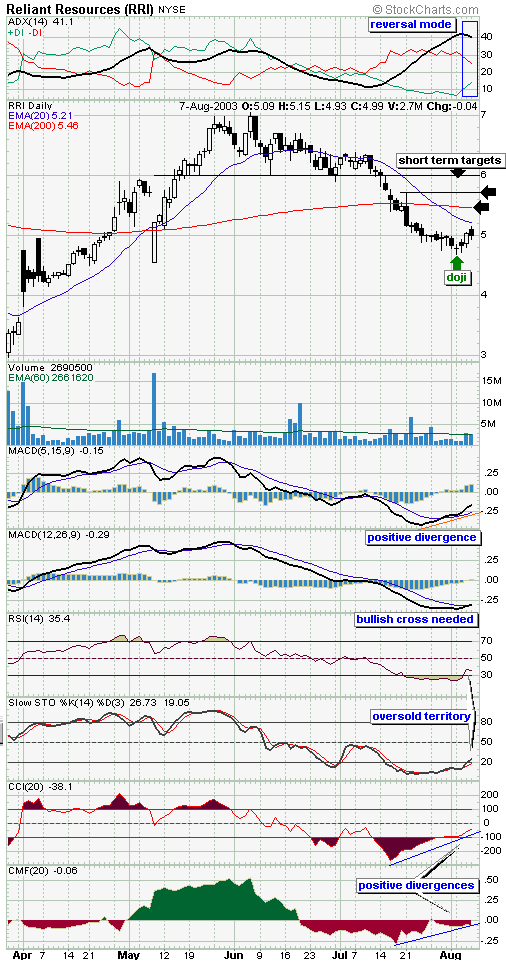
| The daily chart shows this stock was beaten down after succumbing to a double top in June on unexceptional volume. The chart also shows the principal of previous support becoming resistance via the 20-day EMA. Brief support at the 200-day EMA line gave way on a larger volume signal, carrying the stock further down. |
| The doji candlestick ocurring at the recent bottom now begs a question. Is this a bounce that will take the stock back up to a reasonable trading target or is it a bear rally destined to fail at this 20-day EMA overhead resistance? |
|
| Reliant Resources daily chart. |
| Graphic provided by: Stockcharts.com. |
| |
| Doji candlesticks often mark turning points after extended uplegs or downlegs. They show indecision or a balance between the battle between bulls and bears. When this happens at what may be a price extreme, it is often a sign of a shift in momentum. |
| There are some interesting indicators hinting at a move beyond that 20-day overhead resistance. The directional movement indicator is in a bullish reversal mode with overheated ADX pushing for a DI reversal. This set-up is a sign that the previous trend may shift away from bearish (down) power to bullish (up) power. The DIs need to follow through and actually cross to keep the reversal strong. The other indicators below the chart show a combination of positive divergences to recent price action or an oversold condition, both hinting at future bullishness in the short to medium term. |
| Should the stock manage to fight its way past the possible stall point of the 20-day EMA (currently 5.21) then several possible short-term trading targets are indicated. These are 5.46, 5.70 and 6.00. Watch for any potential reversals at or near these suggested trading targets. First things first -- the stock needs to rise past the 20-day EMA to become a buy candidate. |
Independent Canadian equities trader and technical analyst based in Peterborough
Ontario, Canada.
| Website: | www.whatsonsale.ca/financial.html |
| E-mail address: | gwg7@sympatico.ca |
Click here for more information about our publications!
PRINT THIS ARTICLE

Request Information From Our Sponsors
- StockCharts.com, Inc.
- Candle Patterns
- Candlestick Charting Explained
- Intermarket Technical Analysis
- John Murphy on Chart Analysis
- John Murphy's Chart Pattern Recognition
- John Murphy's Market Message
- MurphyExplainsMarketAnalysis-Intermarket Analysis
- MurphyExplainsMarketAnalysis-Visual Analysis
- StockCharts.com
- Technical Analysis of the Financial Markets
- The Visual Investor
- VectorVest, Inc.
- Executive Premier Workshop
- One-Day Options Course
- OptionsPro
- Retirement Income Workshop
- Sure-Fire Trading Systems (VectorVest, Inc.)
- Trading as a Business Workshop
- VectorVest 7 EOD
- VectorVest 7 RealTime/IntraDay
- VectorVest AutoTester
- VectorVest Educational Services
- VectorVest OnLine
- VectorVest Options Analyzer
- VectorVest ProGraphics v6.0
- VectorVest ProTrader 7
- VectorVest RealTime Derby Tool
- VectorVest Simulator
- VectorVest Variator
- VectorVest Watchdog