HOT TOPICS LIST
- MACD
- Fibonacci
- RSI
- Gann
- ADXR
- Stochastics
- Volume
- Triangles
- Futures
- Cycles
- Volatility
- ZIGZAG
- MESA
- Retracement
- Aroon
INDICATORS LIST
LIST OF TOPICS
PRINT THIS ARTICLE
by Gary Grosschadl
This Canadian micro cap is a biometrics provider of fingerprint recognition software and scanning equipment.
Position: Buy
Gary Grosschadl
Independent Canadian equities trader and technical analyst based in Peterborough
Ontario, Canada.
PRINT THIS ARTICLE
FLAGS AND PENNANTS
Bioscrypt Inc. Makes An Impression
08/08/03 12:19:58 PMby Gary Grosschadl
This Canadian micro cap is a biometrics provider of fingerprint recognition software and scanning equipment.
Position: Buy
| With over 50,000 fingerprint readers installed, this small Canadian company has been making inroads into the U.S. markets with its recent high profile contract announcements for New York and Los Angeles government agencies. |
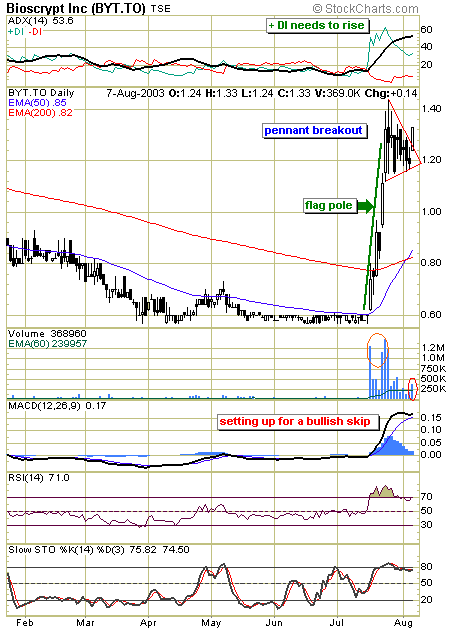
| The daily chart is a very good illustration of how dramatic flag poles and pennants/flags can be. The flag pole advance should be a high volume affair as it propels the stock upwards. Most flag pole advances are not as erect as this one, a doubling of the stock price in quick order will do that. Subsequently a flag or a pennant (as in this case) forms relatively quickly. This shows a brief pause in the established trend and is considered a continuation pattern. Currently the stock is breaking out of its pennant formation on increasing volume. Note the bullish moving average crossover. Typically the exponential moving averages (EMA) cross over before the simple ones (SMA or MA) as they are weighted to more recent action. |

|
| Bioscrypt's dramatic flap pole and pennant formation on their daily chart. |
| Graphic provided by: Stockcharts.com. |
| |
| Two indicators worth noting are the directional movement indicator and the MACD (moving average convergence/divergence). Shown at the top of the chart, the ADX line is above +DI. Normally a strong advance has the ADX line below the +DI (keeps it from getting "overheated"). Ideally the +DI will climb back up as bullish power resumes. The MACD shows a bullish "skip" in the making. Avoiding a bearish crossover here shows this skip potential and is a bullish sign of the former uptrend returning. A refusal to cross is bullish. |
| The target for this pennant advance can be measured by adding the height of the flagpole and applying it to the breakout point. This estimation is (1.40 - .60) + 1.25 = 2.05. A lower target comes from the weekly 200-period EMA which currently is 1.88. First up though is recent resistance at 1.44. The stock has to prove itself by advancing past that mark in the short-term. |
Independent Canadian equities trader and technical analyst based in Peterborough
Ontario, Canada.
| Website: | www.whatsonsale.ca/financial.html |
| E-mail address: | gwg7@sympatico.ca |
Click here for more information about our publications!
PRINT THIS ARTICLE

|

Request Information From Our Sponsors
- StockCharts.com, Inc.
- Candle Patterns
- Candlestick Charting Explained
- Intermarket Technical Analysis
- John Murphy on Chart Analysis
- John Murphy's Chart Pattern Recognition
- John Murphy's Market Message
- MurphyExplainsMarketAnalysis-Intermarket Analysis
- MurphyExplainsMarketAnalysis-Visual Analysis
- StockCharts.com
- Technical Analysis of the Financial Markets
- The Visual Investor
- VectorVest, Inc.
- Executive Premier Workshop
- One-Day Options Course
- OptionsPro
- Retirement Income Workshop
- Sure-Fire Trading Systems (VectorVest, Inc.)
- Trading as a Business Workshop
- VectorVest 7 EOD
- VectorVest 7 RealTime/IntraDay
- VectorVest AutoTester
- VectorVest Educational Services
- VectorVest OnLine
- VectorVest Options Analyzer
- VectorVest ProGraphics v6.0
- VectorVest ProTrader 7
- VectorVest RealTime Derby Tool
- VectorVest Simulator
- VectorVest Variator
- VectorVest Watchdog
