HOT TOPICS LIST
- MACD
- Fibonacci
- RSI
- Gann
- ADXR
- Stochastics
- Volume
- Triangles
- Futures
- Cycles
- Volatility
- ZIGZAG
- MESA
- Retracement
- Aroon
INDICATORS LIST
LIST OF TOPICS
PRINT THIS ARTICLE
by David Penn
Falling below major moving averages suggests pullbacks and corrections in biotechs across the board.
Position: N/A
David Penn
Technical Writer for Technical Analysis of STOCKS & COMMODITIES magazine, Working-Money.com, and Traders.com Advantage.
PRINT THIS ARTICLE
MOVING AVERAGES
Biotech Breakdowns Dead Ahead
08/08/03 09:16:07 AMby David Penn
Falling below major moving averages suggests pullbacks and corrections in biotechs across the board.
Position: N/A
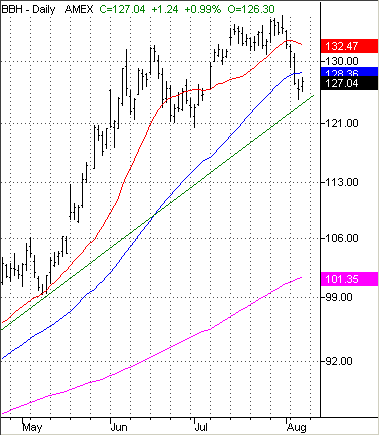
| Is it true what they say about biotechnology stocks, that when Amgen (AMGN) sneezes the rest of the group catches a cold? Looking at the components of the Biotechnology HOLDR, there are stocks that are worse off than Amgen, which broke below its 20-day exponential moving average (EMA) early in August. But the fact that Amgen appears to be joining stocks like Biogen (BGEN) and Genentech (DNA) in a turn toward the downside cannot be interpreted as a short-term good for the biotechnology group. |

|
| Figure 1: Breaking down beneath the 20- and 50-day moving averages, the Biotechnology HOLDRs move toward a test of an up trendline that has been intact since mid-March. |
| Graphic provided by: TradeStation. |
| |
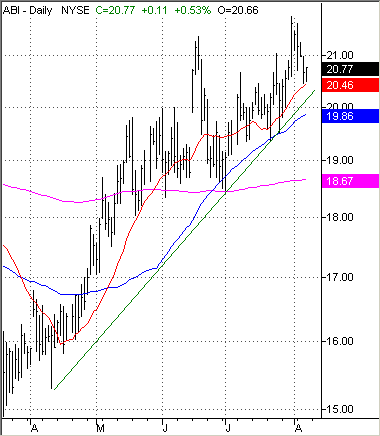
A number of biotechnology stocks have already broken down; four in the HOLDRs group are already trading below their 200-day moving averages, and another five have moved below their 50-day moving averages. As of early August, in fact, there are only four biotechnology stocks in the BBH that appear to be resisting the tug toward lower prices. These are the stocks that should be of particular interest both to bulls looking to buy them at lower prices, as well as bears seeking potential short-term, short selling opportunities. Figure 2: Applera Corporation-Applied Biosystems Group benefited in June from support at the 200-day moving average. Applera Corporation-Applied Biosystems Group (ABI) is among this stalwart (so far) group of biotech stocks that has not (as of August 8th) broken decisively beneath its 20- or 50-day moving averages. In fact, it can be argued that ABI is enjoying a bounce from the previous correction in late June that sent prices plummeting from over 21 to under 19. Currently testing both its 20-day moving averages and an up trendline that extends back to mid-April, ABI is at a crucial point in its bull market -- being up more than 30% since late March. |
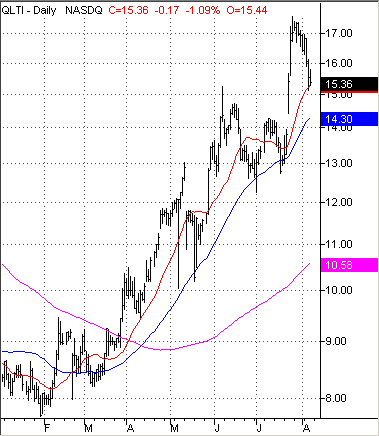
 Figure 3: QLTI has been a volatile gainer for six months running, but another test of support of its 20-day moving average looms. QLT Inc. (QLTI) is another biotechnology stock that has yet to break down. QLTI has enjoyed a bull market that has been more awkward and gap-ridden that that of ABI, but QLTI's bull market also began about a month earlier in February. QLTI has also been a "two-bagger" for its investors; climbing from under $8 a share at the beginning of February to over $17 by late July. |
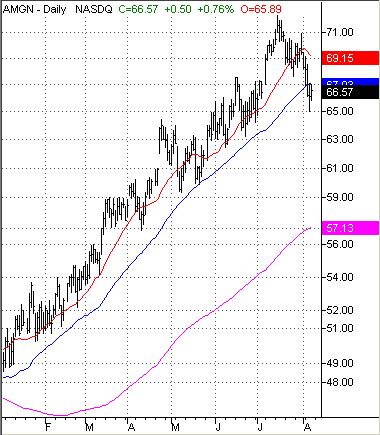
 Figure 4: Amgen has had an excellent bull market run over the past year, more than doubling in price. But breakdowns beneath the 20- and 50-day moving averages point toward a near-term correction. I began this look at biotechnology stocks with Amgen, so it is only appropriate to end there. AMGN has been among the stars of the market reversal that began in October 2002 (and was accentuated by the early 2003 correction and subsequent bottom in March). From a low of $30 in mid-July 2002, AMGN is another two-bagger, currently trading in the mid-60s. The 50-day moving average, which has performed so well as support for AMGN's advance for most of 2003 now presents itself as resistance (at approximately 67) now that AMGN has fallen beneath it. While AMGN, over the course of its year-long advance, has both successfully penetrated and rebounded from its 20-day moving average, it has been careful not to violate the support that the 50-day has been providing. It remains to be seen now whether or not the break in early August means that AMGN's 180-day love affair with the advancing 50-day moving average is over. |
Technical Writer for Technical Analysis of STOCKS & COMMODITIES magazine, Working-Money.com, and Traders.com Advantage.
| Title: | Technical Writer |
| Company: | Technical Analysis, Inc. |
| Address: | 4757 California Avenue SW |
| Seattle, WA 98116 | |
| Phone # for sales: | 206 938 0570 |
| Fax: | 206 938 1307 |
| Website: | www.Traders.com |
| E-mail address: | DPenn@traders.com |
Traders' Resource Links | |
| Charting the Stock Market: The Wyckoff Method -- Books | |
| Working-Money.com -- Online Trading Services | |
| Traders.com Advantage -- Online Trading Services | |
| Technical Analysis of Stocks & Commodities -- Publications and Newsletters | |
| Working Money, at Working-Money.com -- Publications and Newsletters | |
| Traders.com Advantage -- Publications and Newsletters | |
| Professional Traders Starter Kit -- Software | |
Click here for more information about our publications!
Comments
Date: 08/27/03Rank: 5Comment: what is the pink color moving average?how many days was it?you think amgn will fallto 57.13?

Request Information From Our Sponsors
- StockCharts.com, Inc.
- Candle Patterns
- Candlestick Charting Explained
- Intermarket Technical Analysis
- John Murphy on Chart Analysis
- John Murphy's Chart Pattern Recognition
- John Murphy's Market Message
- MurphyExplainsMarketAnalysis-Intermarket Analysis
- MurphyExplainsMarketAnalysis-Visual Analysis
- StockCharts.com
- Technical Analysis of the Financial Markets
- The Visual Investor
- VectorVest, Inc.
- Executive Premier Workshop
- One-Day Options Course
- OptionsPro
- Retirement Income Workshop
- Sure-Fire Trading Systems (VectorVest, Inc.)
- Trading as a Business Workshop
- VectorVest 7 EOD
- VectorVest 7 RealTime/IntraDay
- VectorVest AutoTester
- VectorVest Educational Services
- VectorVest OnLine
- VectorVest Options Analyzer
- VectorVest ProGraphics v6.0
- VectorVest ProTrader 7
- VectorVest RealTime Derby Tool
- VectorVest Simulator
- VectorVest Variator
- VectorVest Watchdog
