HOT TOPICS LIST
- MACD
- Fibonacci
- RSI
- Gann
- ADXR
- Stochastics
- Volume
- Triangles
- Futures
- Cycles
- Volatility
- ZIGZAG
- MESA
- Retracement
- Aroon
INDICATORS LIST
LIST OF TOPICS
PRINT THIS ARTICLE
by Koos van der Merwe
On August 6, 2003 Cisco Systems Inc. reported a jump in quarterly net income but failed to top Wall Street expectations.
Could charts have predicted this?
Position: Sell
Koos van der Merwe
Has been a technical analyst since 1969, and has worked as a futures and options trader with First Financial Futures in Johannesburg, South Africa.
PRINT THIS ARTICLE
DIVERGENCE INDEX
A System For Trading Cisco
08/08/03 12:18:22 PMby Koos van der Merwe
On August 6, 2003 Cisco Systems Inc. reported a jump in quarterly net income but failed to top Wall Street expectations.
Could charts have predicted this?
Position: Sell
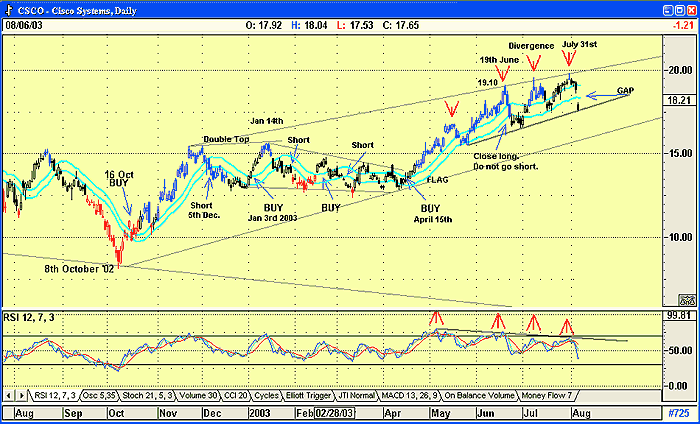
| Below is a daily chart of Cisco Systems with a JM Internal band and an RSI indictor. The JM internal band in this chart is a 15-period moving average band offset by 2% up and -2% down. Buy signals are given when the price breaks above the upper band and sell signals are given when the price breaks below the lower band. With the JM band you are always trading in the direction of the trend, buying high and selling higher, or shorting low and closing lower. When I use this system, I exit a position when a reverse signal is given. Should I be long, I will sell and go short when the close breaks decisively below the lower band, and vice versa when I short. The disadvantage of the strategy is that like any moving average, should the price start moving sideways rather than trending, you can be whipsawed. To overcome this effect, it helps to look at a momentum indicator. In this instance, I have chosen a 12-period RSI indicator. |
| Cisco bottomed on October 8, 2002 and rose, triggering a JM buy at $10.76 on October 16th and closed the position on December 5th at $14.03. The short would have been closed at $13.65 on January 3, 2003. I have illustrated all the other triggers on the chart. As you can see, the majority of trades have been successful. |

|
| Figure 1: Cisco Systems. |
| Graphic provided by: AdvancedGET. |
| |
| The pennant that developed after the double top on January 14th was successful. The price broke out upwards to reach a high of $19.10 on June 19th. However, this high would have been disturbing because, although the price made a higher high (red arrow), the RSI indicator did not. Instead it made a lower high. This divergence of indicator to price is a very strong sell indicator. You would have sold and stayed out of the share. The divergence between price and indicator repeats itself right up until July 31, when Cisco started falling, and then gapped downwards as its quarterly results were released. |
| To conclude, would charts have predicted the fall in Cisco? The answer is decidedly, yes. Because of the divergence between the price and indicator, you would have sold the share if you had owned it on June 20, one day after the divergent top. The continuing divergence would have kept you out of the share. Is Cisco a buy at the moment? Well... it does appear to be finding support on its short-term support line and it should rise to fill the gap, however, its RSI indicator is still falling. I would be inclined to wait for the indicator, which has proven itself, to fall below the 30 level, and start rising before reinvesting. |
Has been a technical analyst since 1969, and has worked as a futures and options trader with First Financial Futures in Johannesburg, South Africa.
| Address: | 3256 West 24th Ave |
| Vancouver, BC | |
| Phone # for sales: | 6042634214 |
| E-mail address: | petroosp@gmail.com |
Click here for more information about our publications!
Comments
Date: 08/12/03Rank: 2Comment:

Request Information From Our Sponsors
- StockCharts.com, Inc.
- Candle Patterns
- Candlestick Charting Explained
- Intermarket Technical Analysis
- John Murphy on Chart Analysis
- John Murphy's Chart Pattern Recognition
- John Murphy's Market Message
- MurphyExplainsMarketAnalysis-Intermarket Analysis
- MurphyExplainsMarketAnalysis-Visual Analysis
- StockCharts.com
- Technical Analysis of the Financial Markets
- The Visual Investor
- VectorVest, Inc.
- Executive Premier Workshop
- One-Day Options Course
- OptionsPro
- Retirement Income Workshop
- Sure-Fire Trading Systems (VectorVest, Inc.)
- Trading as a Business Workshop
- VectorVest 7 EOD
- VectorVest 7 RealTime/IntraDay
- VectorVest AutoTester
- VectorVest Educational Services
- VectorVest OnLine
- VectorVest Options Analyzer
- VectorVest ProGraphics v6.0
- VectorVest ProTrader 7
- VectorVest RealTime Derby Tool
- VectorVest Simulator
- VectorVest Variator
- VectorVest Watchdog
