HOT TOPICS LIST
- MACD
- Fibonacci
- RSI
- Gann
- ADXR
- Stochastics
- Volume
- Triangles
- Futures
- Cycles
- Volatility
- ZIGZAG
- MESA
- Retracement
- Aroon
INDICATORS LIST
LIST OF TOPICS
PRINT THIS ARTICLE
by David Penn
Do a positive MACD divergence and moving average support point to higher coffee prices?
Position: N/A
David Penn
Technical Writer for Technical Analysis of STOCKS & COMMODITIES magazine, Working-Money.com, and Traders.com Advantage.
PRINT THIS ARTICLE
MACD
Coffee's Double Bottom Comeback?
08/07/03 01:38:53 PMby David Penn
Do a positive MACD divergence and moving average support point to higher coffee prices?
Position: N/A
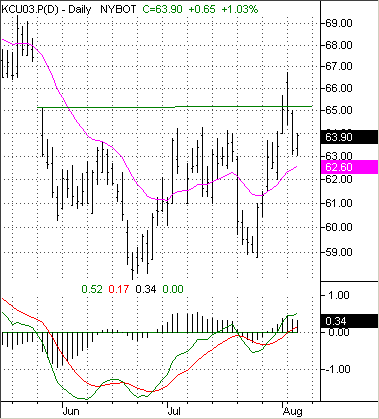
| In late June, I asked what it would take for coffee futures to put in a bottom ("Coffee Grinding Down," Traders.com Advantage, June 23, 2003). At the time, I suggested that the June trough lows in the MACD would be one clue as to whether or not coffee futures (particularly the September contract) would bounce and resume the advance that began earlier in June. As it turned out the pair of MACD trough lows in June were inconclusive. However, the higher MACD trough low that developed in July did confirm the higher low coffee prices established in July, and pointed to higher prices in the near-term. Over the next seven days, September coffee rose from 59 cents to over 66 cents. |
| Coffee futures have since retreated from their late July/early August heights. But the rally that began in July may still have legs if coffee is able to find support on the back of the 20-day exponential moving average shown here in magenta. Finding support on the 20-day EMA would be especially impressive as coffee was unable to use this moving average as support for very long in the wake of its last move up from the bottom in early July. |

|
| This consolidation in coffee futures may yet turn out to be a bullish double bottom reversal if support at the 20-day EMA holds up. |
| Graphic provided by: TradeStation. |
| |
| If coffee does indeed find support around 62.5, then it is quite likely that the double bottom reversal formation that began in late May will prove itself to be valid. A swing rule interpretation of what this would mean in price terms uses the low point of about 58 from mid-June and a "swing" level of 64 (as represented by the late June/early to mid-July highs. Subtracting the low point value from the "swing" level value gives a breakout projection of 6 points which, when added to the value at the swing level, gives an upside target of 70 in an initial move. Such a move would set up September coffee for a test of the May 2003 highs just north of 72. |
Technical Writer for Technical Analysis of STOCKS & COMMODITIES magazine, Working-Money.com, and Traders.com Advantage.
| Title: | Technical Writer |
| Company: | Technical Analysis, Inc. |
| Address: | 4757 California Avenue SW |
| Seattle, WA 98116 | |
| Phone # for sales: | 206 938 0570 |
| Fax: | 206 938 1307 |
| Website: | www.Traders.com |
| E-mail address: | DPenn@traders.com |
Traders' Resource Links | |
| Charting the Stock Market: The Wyckoff Method -- Books | |
| Working-Money.com -- Online Trading Services | |
| Traders.com Advantage -- Online Trading Services | |
| Technical Analysis of Stocks & Commodities -- Publications and Newsletters | |
| Working Money, at Working-Money.com -- Publications and Newsletters | |
| Traders.com Advantage -- Publications and Newsletters | |
| Professional Traders Starter Kit -- Software | |
Click here for more information about our publications!
Comments
Date: 09/21/03Rank: 2Comment:

Request Information From Our Sponsors
- StockCharts.com, Inc.
- Candle Patterns
- Candlestick Charting Explained
- Intermarket Technical Analysis
- John Murphy on Chart Analysis
- John Murphy's Chart Pattern Recognition
- John Murphy's Market Message
- MurphyExplainsMarketAnalysis-Intermarket Analysis
- MurphyExplainsMarketAnalysis-Visual Analysis
- StockCharts.com
- Technical Analysis of the Financial Markets
- The Visual Investor
- VectorVest, Inc.
- Executive Premier Workshop
- One-Day Options Course
- OptionsPro
- Retirement Income Workshop
- Sure-Fire Trading Systems (VectorVest, Inc.)
- Trading as a Business Workshop
- VectorVest 7 EOD
- VectorVest 7 RealTime/IntraDay
- VectorVest AutoTester
- VectorVest Educational Services
- VectorVest OnLine
- VectorVest Options Analyzer
- VectorVest ProGraphics v6.0
- VectorVest ProTrader 7
- VectorVest RealTime Derby Tool
- VectorVest Simulator
- VectorVest Variator
- VectorVest Watchdog
