HOT TOPICS LIST
- MACD
- Fibonacci
- RSI
- Gann
- ADXR
- Stochastics
- Volume
- Triangles
- Futures
- Cycles
- Volatility
- ZIGZAG
- MESA
- Retracement
- Aroon
INDICATORS LIST
LIST OF TOPICS
PRINT THIS ARTICLE
by Gary Grosschadl
Intel Corp. is in a sideways consolidation and will eventually break out but which way?
Position: Hold
Gary Grosschadl
Independent Canadian equities trader and technical analyst based in Peterborough
Ontario, Canada.
PRINT THIS ARTICLE
CHART ANALYSIS
Intel Caught In A Trading Range
08/07/03 01:36:01 PMby Gary Grosschadl
Intel Corp. is in a sideways consolidation and will eventually break out but which way?
Position: Hold
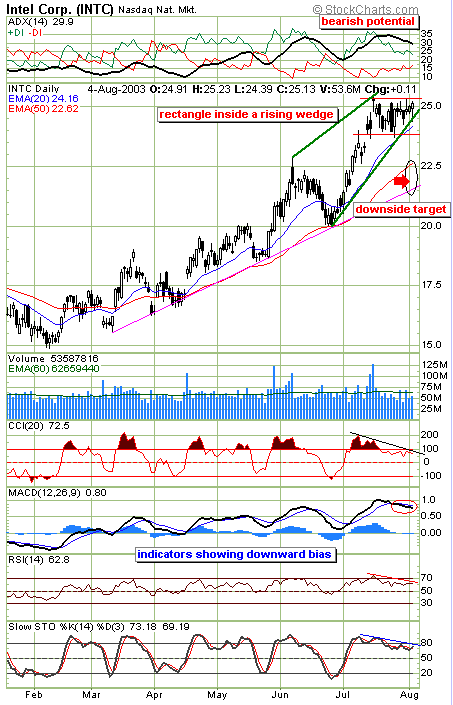
| As this daily chart shows, Intel has been in a good uptrend, running from $15 to $25 in six months. The short-term pattern has it consolidating recent gains in a sideways pattern via a rectangle. The larger pattern shows a potentially bearish rising wedge. |
| This wedge pattern shows an accelerated upleg when compaed to the slope of the former trendline. This well illustrates why these wedges often are bearish developments as this steeper rise hints at unsustainability. When advances come too suddenly, profit takers and shorters take notice and begin to anticipate coming reversals. |

|
| Intel's daily chart showing a pattern within a pattern. |
| Graphic provided by: Stockcharts.com. |
| |
| So it should be no surprise that a consolidation phase was due. The rectangle is neutral and a break can come in either direction. A break to the downside triggers the rising wedge failure while an upside break sends the stock to a possible encounter with the wedge's upper trendline and sets up a future wedge failure possibility. |
| The displayed indicators are hinting at a downward bias or the chance of early failure. The directional movement indicator at the top of the chart is showing the ADX line coming off a peak and declining. This means that the previous trend has weakened and the converging DIs threaten to bearishly cross. A refusal to cross or a weak cross that soon reverses would be a sign of a bounce or resumption of the former uptrend as was the previous case of the bounce at $20. The other indicators below the chart all have a bearish bias right now. As the stock has been drifting sideways in the rectangle, these indicators have been heading down and can be considered negative divergences to price action. |
| Should these indicators be right about the bearish trend, two downside targets are suggested, the first being the 50-day EMA currently $22.62.If that doesn't hold then the trendline in the vicinity of $21.50. It may be more prudent to simply wait for the rectangle to break either way, tipping a bigger move in the works. |
Independent Canadian equities trader and technical analyst based in Peterborough
Ontario, Canada.
| Website: | www.whatsonsale.ca/financial.html |
| E-mail address: | gwg7@sympatico.ca |
Click here for more information about our publications!
Comments
Date: 08/12/03Rank: 5Comment:
Date: 08/27/03Rank: 3Comment: what you thinkabout intc. now itbreak up where is the resistance?

Request Information From Our Sponsors
- VectorVest, Inc.
- Executive Premier Workshop
- One-Day Options Course
- OptionsPro
- Retirement Income Workshop
- Sure-Fire Trading Systems (VectorVest, Inc.)
- Trading as a Business Workshop
- VectorVest 7 EOD
- VectorVest 7 RealTime/IntraDay
- VectorVest AutoTester
- VectorVest Educational Services
- VectorVest OnLine
- VectorVest Options Analyzer
- VectorVest ProGraphics v6.0
- VectorVest ProTrader 7
- VectorVest RealTime Derby Tool
- VectorVest Simulator
- VectorVest Variator
- VectorVest Watchdog
- StockCharts.com, Inc.
- Candle Patterns
- Candlestick Charting Explained
- Intermarket Technical Analysis
- John Murphy on Chart Analysis
- John Murphy's Chart Pattern Recognition
- John Murphy's Market Message
- MurphyExplainsMarketAnalysis-Intermarket Analysis
- MurphyExplainsMarketAnalysis-Visual Analysis
- StockCharts.com
- Technical Analysis of the Financial Markets
- The Visual Investor
