HOT TOPICS LIST
- MACD
- Fibonacci
- RSI
- Gann
- ADXR
- Stochastics
- Volume
- Triangles
- Futures
- Cycles
- Volatility
- ZIGZAG
- MESA
- Retracement
- Aroon
INDICATORS LIST
LIST OF TOPICS
PRINT THIS ARTICLE
by David Penn
An Elliott wave interpretation of the current bull market suggests a correction before higher prices.
Position: N/A
David Penn
Technical Writer for Technical Analysis of STOCKS & COMMODITIES magazine, Working-Money.com, and Traders.com Advantage.
PRINT THIS ARTICLE
ELLIOTT WAVE
A Five-Wave Look At The Spring/Summer Rally of 2003
08/05/03 11:14:09 AMby David Penn
An Elliott wave interpretation of the current bull market suggests a correction before higher prices.
Position: N/A
| In "Revisiting the Triple Bottom Breakout" (July 22, 2003; Traders.com Advantage), I suggested that the S&P 500 was likely to correct significantly before heading to what I believed might be higher prices down the road. That article pointed to the breakout from a near year-long consolidation, and the possibility that this breakout may be pulling back toward the breakout level. This was based both on recent weakness in the S&P 500 itself, as well as a negative divergence with the MACD and declining market "internals" -- such as a faltering advance/decline line. I think this near-term bearish view -- again, in the context of an intermediate bullish move that is not yet over -- is further supported by an Elliott wave analysis of the components of the March 2003 to present advance. On close inspection, it appears that this countertrend move will quite possibly consist of five different stages or waves, and that the market's stagnation in June and July 2003 is a to-be-expected aspect of this five-stage progression. |
| What are the five waves? While Elliott wave theorists have spent a great deal of time looking into the mathematical relationships between the different waves of the five wave structure, I think that considering the market psychology accompanying these different waves is also worth studying -- and perhaps even the application of technically-oriented sentiment tools and measurements such as the VIX. Here are partial descriptions of the psychology behind the various waves, as described by Robert Prechter of Elliott Wave International: Wave One: "Rebound from low valuation. Recognition of survival." Wave Two: "Test of lows. Underlying trend (still) believed to be down." Wave Three: "Strength. Breadth. Increasing real prosperity." Wave Four: "Surprising disappointment." Wave Five: "Optimism creates lofty valuation." |

|
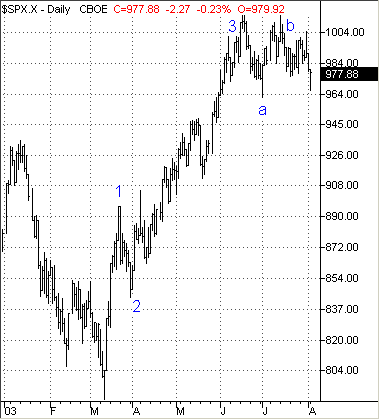
| Figure 1: The first three completed waves of the March to August 2003 rally in the S&P 500. |
| Graphic provided by: TradeStation. |
| |
| I believe wave one -- the "rebound" wave in the current rally lasted from the bottom on March 12 to the short-term peak on March 24. The "test of lows" of the second wave appears to have bottomed at the end of the month. The third wave -- which represents "strength", "breadth" and "increasingly real prosperity" -- began in April and carried the S&P 500 until the peak in mid-June (approximately June 18). This was the "easy" part of the S&P 500 rally -- as befits a third wave rally in a bull market -- with market psychology getting more bullish by the day. From April 10 to June 18, the VIX fell from just under 29 to just below 22, and the advance/decline line roared higher. Breadth was impressive -- almost frighteningly so as many stocks that had suffered the most in the three-year bear market -- including formerly high-flying Internet stocks -- were among the leaders in the advance during this period. What does this suggest in the near term for the S&P 500? It appears as if the S&P 500's sideways movement is part of a fourth wave consolidation. Fourth waves, as Prechter notes, are characterized by "surprising disappointments" -- "surprising" compared to the general good feelings that develop during the previous third wave. Fourth waves also -- borrowing from Richard Wyckoff -- tend to serve as distribution zones during which those who were prescient enough to buy into the market during the previous waves, use the consolidation of fourth waves to take profits. |
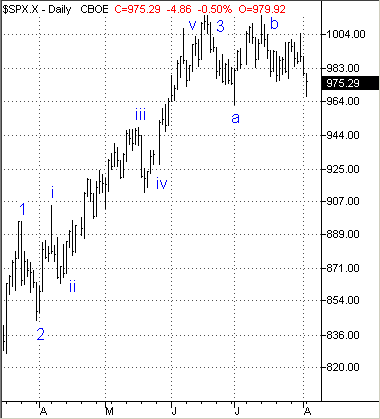
 Figure 2: The current fourth wave should find support in the area of the fourth wave of one smaller degree--somewhere in the 920s, most likely. If the S&P 500 is moving through a fourth wave, then the next question is how will the fourth wave correction complete itself? Corrections are generally three-wave affairs (unless they are triangles or part of compound structures like doubles and triples) and if the S&P 500's fourth wave follows this pattern, then it is reasonable to project a wave "a" low on July 1, and a wave "b" high on July 14 -- when the S&P again broke above 1000. Both of these corrective waves were themselves composed of three parts, which is especially important when looking toward what could be the final wave "c" of the fourth wave. Why so? It appears that the final wave "c" in this fourth wave might have already commenced with the final third of its three-stage descent. The first stage would have been the decline from 1014 to 976 from approximately July 14 to July 22. The second stage would have been the rally from about 976 to 1002 from July 22 to July 31. The third -- and current stage -- represents the decline from the 1002 area. |
| How far down might a fourth wave correction go? In "Revisiting the Triple Bottom Breakout" I made the case for a short-term correction to the 920 area. I think the current Elliott wave analysis supports a correction to these levels -- if not somewhat lower. I come to this conclusion by looking at the smaller five-wave structure within wave three (mid-April to mid-June, approximately). Generally speaking, the fourth wave correction in one five-wave sequence tends to find support at the level of the fourth wave trough low of the previous five-wave sequence OF ONE SMALLER DEGREE. Thus, the end to the current fourth wave correction might possibly be found late in the fourth wave of the five-wave sequence from mid-April to mid-June. Looking at the five-wave sequence that occurred during the larger wave 3, we can spot a smaller fourth wave low at approximately 911. This, then, is the most likely support point -- and concluding point for any wave "c" that would end the fourth wave correction. |
Technical Writer for Technical Analysis of STOCKS & COMMODITIES magazine, Working-Money.com, and Traders.com Advantage.
| Title: | Technical Writer |
| Company: | Technical Analysis, Inc. |
| Address: | 4757 California Avenue SW |
| Seattle, WA 98116 | |
| Phone # for sales: | 206 938 0570 |
| Fax: | 206 938 1307 |
| Website: | www.Traders.com |
| E-mail address: | DPenn@traders.com |
Traders' Resource Links | |
| Charting the Stock Market: The Wyckoff Method -- Books | |
| Working-Money.com -- Online Trading Services | |
| Traders.com Advantage -- Online Trading Services | |
| Technical Analysis of Stocks & Commodities -- Publications and Newsletters | |
| Working Money, at Working-Money.com -- Publications and Newsletters | |
| Traders.com Advantage -- Publications and Newsletters | |
| Professional Traders Starter Kit -- Software | |
Click here for more information about our publications!
PRINT THIS ARTICLE

|

Request Information From Our Sponsors
- StockCharts.com, Inc.
- Candle Patterns
- Candlestick Charting Explained
- Intermarket Technical Analysis
- John Murphy on Chart Analysis
- John Murphy's Chart Pattern Recognition
- John Murphy's Market Message
- MurphyExplainsMarketAnalysis-Intermarket Analysis
- MurphyExplainsMarketAnalysis-Visual Analysis
- StockCharts.com
- Technical Analysis of the Financial Markets
- The Visual Investor
- VectorVest, Inc.
- Executive Premier Workshop
- One-Day Options Course
- OptionsPro
- Retirement Income Workshop
- Sure-Fire Trading Systems (VectorVest, Inc.)
- Trading as a Business Workshop
- VectorVest 7 EOD
- VectorVest 7 RealTime/IntraDay
- VectorVest AutoTester
- VectorVest Educational Services
- VectorVest OnLine
- VectorVest Options Analyzer
- VectorVest ProGraphics v6.0
- VectorVest ProTrader 7
- VectorVest RealTime Derby Tool
- VectorVest Simulator
- VectorVest Variator
- VectorVest Watchdog
