HOT TOPICS LIST
- MACD
- Fibonacci
- RSI
- Gann
- ADXR
- Stochastics
- Volume
- Triangles
- Futures
- Cycles
- Volatility
- ZIGZAG
- MESA
- Retracement
- Aroon
INDICATORS LIST
LIST OF TOPICS
PRINT THIS ARTICLE
by Kevin Hopson
The AMEX Oil Index (XOI) looks to have additional downside potential in the near-term but I would consider a further pullback an excellent buying opportunity.
Position: Accumulate
Kevin Hopson
Kevin has been a technical analyst for roughly 10 years now. Previously, Kevin owned his own business and acted as a registered investment advisor, specializing in energy. He was also a freelance oil analyst for Orient Trading Co., a commodity futures trading firm in Japan. Kevin is currently a freelance writer.
PRINT THIS ARTICLE
TECHNICAL ANALYSIS
Downside Potential In The AMEX Oil Index
08/04/03 12:43:12 PMby Kevin Hopson
The AMEX Oil Index (XOI) looks to have additional downside potential in the near-term but I would consider a further pullback an excellent buying opportunity.
Position: Accumulate
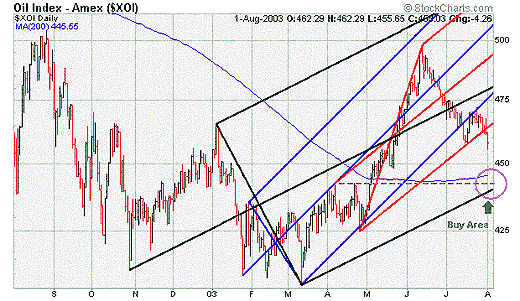
| The AMEX Oil Index (XOI), a price-weighted index of large-cap integrated oil companies, looks vulnerable to a further pull back in the near-term. If you look at the 1-year chart, you will notice that the index recently broke below the bottom parallel line of the blue pitchfork, which had supported prices since March. Since broken support has a tendency to turn into resistance, it was not a surprise that this trendline capped prices last month. |
| Unfortunately, the index breached the bottom parallel line of the red pitchfork last Friday. This trendline acted as initial support in mid-July but has now given way. As a result, it appears that the XOI has further room to the downside. Even so, the downside potential looks to be limited. For example, the 450 level - site of the 50 percent retracement from the March-June rally and peak put open interest - could act as a good bouncing point in the short-term. |

|
| Graphic provided by: Stockcharts.com. |
| |
| However, I am inclined to believe that the index will pull back a little further. More specifically, there is a significant confluence of support in the 440 to 445 range, which should act as the ultimate downside target for the XOI. For example, this is the site of May's triple top breakout, the bottom parallel line of the black pitchfork, the index's 200-day moving average and the 61.8 percent retracement level from the March-June rally. |
| Since it is my belief that the index put in a significant long-term bottom back in March and is currently in the second wave (corrective wave) of a new uptrend, I continue to recommend accumulation of integrated oil companies in the near-term. If the XOI does pull back to my target price range (440-445), I would be a heavy buyer at these levels. In other words, I would accumulate on the way down and take a full position in the 440 to 445 range. |
Kevin has been a technical analyst for roughly 10 years now. Previously, Kevin owned his own business and acted as a registered investment advisor, specializing in energy. He was also a freelance oil analyst for Orient Trading Co., a commodity futures trading firm in Japan. Kevin is currently a freelance writer.
| Glen Allen, VA | |
| E-mail address: | hopson_1@yahoo.com |
Click here for more information about our publications!
Comments
Date: 08/05/03Rank: 4Comment:
Date: 08/05/03Rank: 5Comment:
Date: 08/05/03Rank: 5Comment:

|

Request Information From Our Sponsors
- StockCharts.com, Inc.
- Candle Patterns
- Candlestick Charting Explained
- Intermarket Technical Analysis
- John Murphy on Chart Analysis
- John Murphy's Chart Pattern Recognition
- John Murphy's Market Message
- MurphyExplainsMarketAnalysis-Intermarket Analysis
- MurphyExplainsMarketAnalysis-Visual Analysis
- StockCharts.com
- Technical Analysis of the Financial Markets
- The Visual Investor
- VectorVest, Inc.
- Executive Premier Workshop
- One-Day Options Course
- OptionsPro
- Retirement Income Workshop
- Sure-Fire Trading Systems (VectorVest, Inc.)
- Trading as a Business Workshop
- VectorVest 7 EOD
- VectorVest 7 RealTime/IntraDay
- VectorVest AutoTester
- VectorVest Educational Services
- VectorVest OnLine
- VectorVest Options Analyzer
- VectorVest ProGraphics v6.0
- VectorVest ProTrader 7
- VectorVest RealTime Derby Tool
- VectorVest Simulator
- VectorVest Variator
- VectorVest Watchdog
