HOT TOPICS LIST
- MACD
- Fibonacci
- RSI
- Gann
- ADXR
- Stochastics
- Volume
- Triangles
- Futures
- Cycles
- Volatility
- ZIGZAG
- MESA
- Retracement
- Aroon
INDICATORS LIST
LIST OF TOPICS
PRINT THIS ARTICLE
by Gary Grosschadl
Ascending triangles have a bullish bias but this one is somewhat unusual due to recent violent swings.
Position: Hold
Gary Grosschadl
Independent Canadian equities trader and technical analyst based in Peterborough
Ontario, Canada.
PRINT THIS ARTICLE
ASCENDING TRIANGLES
A Labored Breakout For Veritas Software
08/01/03 10:03:24 AMby Gary Grosschadl
Ascending triangles have a bullish bias but this one is somewhat unusual due to recent violent swings.
Position: Hold
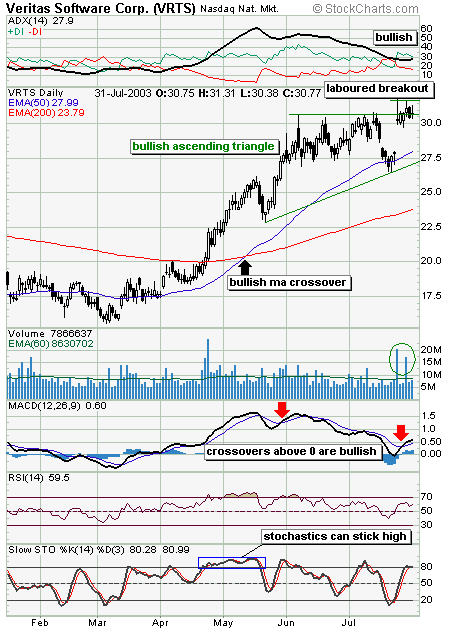
| Veritas Software has had quite an impressive ride since making a move past its 200-day moving average last April. This is often a good trading signal and in this case it certainly was. Another MA trading signal came later with the crossover of the 50-day EMA and the 200-day EMA. This is one of the more popular crossover signals for traders and fund managers alike. The interesting observation here is that most traders would have been stopped out-- soon after the crossover the stock moved below that entry point and below recent support. Another good trading signal came with the hammer candlestick off the quick retracement. The lesson perhaps is, if the stock has already run hard, wait for the first retracement after the 50/200 MA crossover. |
| That hammer signal now serves as a data point for the bottom trendline of the current ascending triangle formation. That rise topped out near the $30.50 mark and was tested several times, establishing the top trendline of the triangle. The stock took a vicious drop off the last trendline test to find support just under the 50-day EMA, giving the second anchor to draw the lower trendline. |

|
| Daily chart for Veritas Software. |
| Graphic provided by: Stockcharts.com. |
| |
| The subsequent move back up was more dramatic than the down move as witnessed by the large gap. |
| Normally any breakout of a pattern formation, be it up or down, should come with convincing volume. The chart shows two big volume spikes as traders reacted to apparent price breakouts. These moves were limited to another ceiling of $31.50 via shooting star-type candles with long upper shadows. |
| Traders now are left in a bit of a quandry. Is this a failed breakout or just a delayed one? Checking some indicators gives us clues. The directional movement indicator (top of chart) shows a bullish set up still exists but +DI has to reverse course to keep above the still healthy ADX line. The MACD line (moving average convergence/divergence) is still bullish and especially so having done a crossover above the zero line. The RSI line (relative strength index) remains above 50 to maintain its bullish stance. Stochastics shows an overbought situation and reflects the dilemma. The stock can continue up but only if it is strongly trending as was the previous case looking back. The ADX line will be a good guide going forward. Strongly trending markets are usually noted by a strong and rising ADX line, ideally above 30. So I would watch that line carefully. ADX is currently 27.9 and I would prefer to see it rise above 30 to show good trend strength going forward. The easier answer pricewise is simply to wait for a convincing move, either above the recent ceiling of $31.50 (breakout is good) or a move back down below $30 which may signal another test of the lower trendline. This stock like many others are reflecting the choppy market conditions. |
Independent Canadian equities trader and technical analyst based in Peterborough
Ontario, Canada.
| Website: | www.whatsonsale.ca/financial.html |
| E-mail address: | gwg7@sympatico.ca |
Click here for more information about our publications!
PRINT THIS ARTICLE

|

Request Information From Our Sponsors
- StockCharts.com, Inc.
- Candle Patterns
- Candlestick Charting Explained
- Intermarket Technical Analysis
- John Murphy on Chart Analysis
- John Murphy's Chart Pattern Recognition
- John Murphy's Market Message
- MurphyExplainsMarketAnalysis-Intermarket Analysis
- MurphyExplainsMarketAnalysis-Visual Analysis
- StockCharts.com
- Technical Analysis of the Financial Markets
- The Visual Investor
- VectorVest, Inc.
- Executive Premier Workshop
- One-Day Options Course
- OptionsPro
- Retirement Income Workshop
- Sure-Fire Trading Systems (VectorVest, Inc.)
- Trading as a Business Workshop
- VectorVest 7 EOD
- VectorVest 7 RealTime/IntraDay
- VectorVest AutoTester
- VectorVest Educational Services
- VectorVest OnLine
- VectorVest Options Analyzer
- VectorVest ProGraphics v6.0
- VectorVest ProTrader 7
- VectorVest RealTime Derby Tool
- VectorVest Simulator
- VectorVest Variator
- VectorVest Watchdog
