HOT TOPICS LIST
- MACD
- Fibonacci
- RSI
- Gann
- ADXR
- Stochastics
- Volume
- Triangles
- Futures
- Cycles
- Volatility
- ZIGZAG
- MESA
- Retracement
- Aroon
INDICATORS LIST
LIST OF TOPICS
PRINT THIS ARTICLE
by Kevin Hopson
The Oil Services Index (OSX) has been in a steep correction the last several weeks but is now showing signs of bottoming out.
Position: Hold
Kevin Hopson
Kevin has been a technical analyst for roughly 10 years now. Previously, Kevin owned his own business and acted as a registered investment advisor, specializing in energy. He was also a freelance oil analyst for Orient Trading Co., a commodity futures trading firm in Japan. Kevin is currently a freelance writer.
PRINT THIS ARTICLE
TECHNICAL ANALYSIS
The Oil Services Index Tries To Regroup At Key Support
08/01/03 10:46:45 AMby Kevin Hopson
The Oil Services Index (OSX) has been in a steep correction the last several weeks but is now showing signs of bottoming out.
Position: Hold
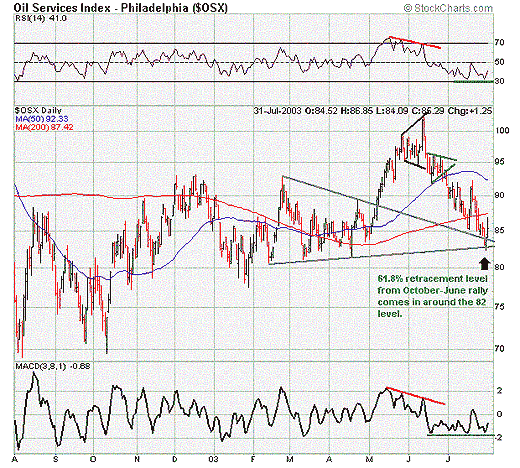
| The Oil Services Index (OSX) has been in a steep correction since topping out in mid-June. More specifically, the index has lost 20 percent of its value over the last six weeks alone. As the old cliche goes, a picture is worth a thousand words. If you look at the 1-year chart for the OSX, you will see what I mean. |
| For example, notice how the OSX broke out of a bullish triangle formation in early May. Investors who had bought on the initial breakout would have done well in the coming weeks. However, those same investors would have suffered huge losses if they failed to heed the warning signs later on. More specifically, notice how the relative strength index (RSI) and moving average convergence/divergence (MACD) both moved lower as the OSX continued to move higher. These were bearish divergences and should have warned investors of a forthcoming top. |

|
| Graphic provided by: Stockcharts.com. |
| |
| If that was not enough, the OSX also formed an expanding triangle. This type of triangle formation usually indicates extreme volatility in the market. Since this type of market behavior tends to occur at significant tops, investors should have considered taking profits at this stage. Even if investors had ignored the initial signs, the bearish pennant formation (upside down pennant) provided them a second chance to get out. This is illustrated by the green trendlines. A bearish pennant is a consolidation phase before the next move down. As a result, once this pattern started to form, those investors who failed to get out the first time around should have considered it a gift. |
| Once the index breached its 50- and 200-day moving averages, it was all over. However, just like there were bearish divergences leading up to June's high, there have been bullish divergences in the OSX the last few weeks. For example, notice how the RSI and MACD have put in a double bottom and triple bottom, respectively. This has occurred in light of the index moving lower. Additionally, notice how the index recently bounced off the former triangle formation, as well as the 61.8 percent retracement level from the Oct.-June rally. These are all signs of a potential bottoming pattern. |
| Unfortunately, the index has to do three things to confirm that a bottom is in place. For one, the index has to close back above its 200-day moving average. Secondly, the RSI must cross above 50, where it has been finding resistance lately. Last but not least, the MACD must move above zero. These three things combined should indicate a change in the short-term trend and a safer entry point for investors. Until then, I would stay on the sidelines. |
Kevin has been a technical analyst for roughly 10 years now. Previously, Kevin owned his own business and acted as a registered investment advisor, specializing in energy. He was also a freelance oil analyst for Orient Trading Co., a commodity futures trading firm in Japan. Kevin is currently a freelance writer.
| Glen Allen, VA | |
| E-mail address: | hopson_1@yahoo.com |
Click here for more information about our publications!
Comments
Date: 08/02/03Rank: 5Comment:
Date: 08/05/03Rank: 5Comment:
Date: 08/05/03Rank: 4Comment:

|

Request Information From Our Sponsors
- StockCharts.com, Inc.
- Candle Patterns
- Candlestick Charting Explained
- Intermarket Technical Analysis
- John Murphy on Chart Analysis
- John Murphy's Chart Pattern Recognition
- John Murphy's Market Message
- MurphyExplainsMarketAnalysis-Intermarket Analysis
- MurphyExplainsMarketAnalysis-Visual Analysis
- StockCharts.com
- Technical Analysis of the Financial Markets
- The Visual Investor
- VectorVest, Inc.
- Executive Premier Workshop
- One-Day Options Course
- OptionsPro
- Retirement Income Workshop
- Sure-Fire Trading Systems (VectorVest, Inc.)
- Trading as a Business Workshop
- VectorVest 7 EOD
- VectorVest 7 RealTime/IntraDay
- VectorVest AutoTester
- VectorVest Educational Services
- VectorVest OnLine
- VectorVest Options Analyzer
- VectorVest ProGraphics v6.0
- VectorVest ProTrader 7
- VectorVest RealTime Derby Tool
- VectorVest Simulator
- VectorVest Variator
- VectorVest Watchdog
