HOT TOPICS LIST
- MACD
- Fibonacci
- RSI
- Gann
- ADXR
- Stochastics
- Volume
- Triangles
- Futures
- Cycles
- Volatility
- ZIGZAG
- MESA
- Retracement
- Aroon
INDICATORS LIST
LIST OF TOPICS
PRINT THIS ARTICLE
by Koos van der Merwe
Teva Pharmaceuticals develops, manufactures and markets generic pharmaceuticals. Teva sells its products to chains, wholesalers, distributors, hospitals, managed care entities, and government agencies. With the high cost of pharmaceuticals, generic drugs, once patents expire, take over at much cheaper prices than the original. Teva has had a good run but its price is looking "toppy." What do the charts tell us?
Position: Sell
Koos van der Merwe
Has been a technical analyst since 1969, and has worked as a futures and options trader with First Financial Futures in Johannesburg, South Africa.
PRINT THIS ARTICLE
ELLIOTT WAVE
Has Teva Overdosed?
08/01/03 08:37:17 AMby Koos van der Merwe
Teva Pharmaceuticals develops, manufactures and markets generic pharmaceuticals. Teva sells its products to chains, wholesalers, distributors, hospitals, managed care entities, and government agencies. With the high cost of pharmaceuticals, generic drugs, once patents expire, take over at much cheaper prices than the original. Teva has had a good run but its price is looking "toppy." What do the charts tell us?
Position: Sell
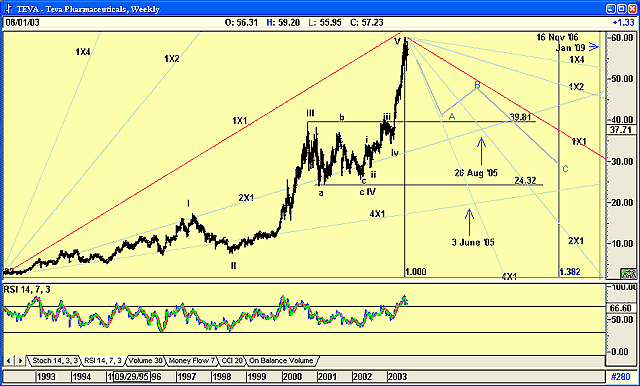
| The chart below is a weekly bar chart of the company. On it I have drawn my preferred Elliott wave count and Gann lines. I have also included a Fibonocci time count from the low of $1.92 on January 3, 1992. I have chosen this point to start my count, as Advanced GET has automatically selected it as a pivot point. Also, when I prepare a Gann fan with 0.1 as my scale, the 1x1 line tops out close to the high of $59.70 on July 4, 2003. Interpreting the charts |
 Figure 1: TEVA weekly chart. a. The Elliott wave count on the weekly chart suggests that Teva may be topping out in Wave V. This means that it should now be falling in an ABC count, which would take it to area of the 4th Wave of lesser degree, which is the area between $39.81 and $24.32. In the chart I have suggested that wave A down could find support at $39.41, the high of Wave III, but this need not necessarily be so. b. The Gann fan chosen is a fan with 0.1 as the scale. I am a traditionalist, and prefer to use the same numbers WD Gann used, namely 1, 2, and 5, and multiples and division by 10 of these numbers. I am not happy with the newer computer generated fans which "fix" the fan to fit the chart. Wave A could bottom at the point where the two 4x1 fan lines cross. This would be about June 3, 2005. Wave B could top at the position where the 2x1 line of the rising Gann fan and the 2x1 of the falling Gann fan cross. Nether dates are a definite, but they do give a suggested date for both turning points. Gann suggests a bottom date for the C-wave at January 2009. c. The Fibonocci time count suggests that Wave C could bottom on November 16, 2006. This time zone is based on a 38.2% estimate of the rise from January 3, 1992 to July 4, 2003. This differs from the Gann fan estimate, and should not be ignored. d. The RSI indicator is overbought, but the weekly chart has not given a sell signal... yet. |

|
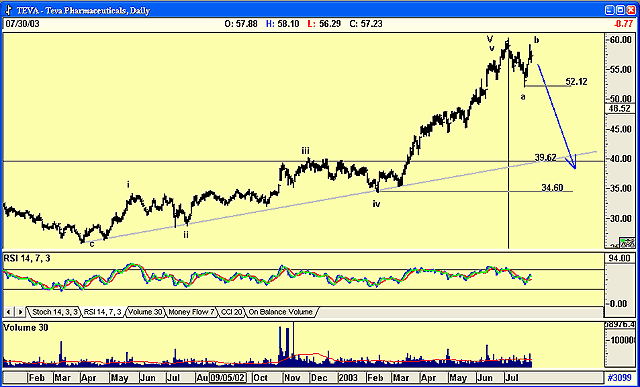
| Figure 2: TEVA daily chart. |
| Graphic provided by: AdvancedGET. |
| |
| a. The daily chart above shows the internal count of Wave V, and has completed what could be an a-wave down and a b-wave up to form a double top. The chart also suggests that the c-wave which could be the A-Wave on the weekly chart could end at the $34.60 to $39.62 level. b. The RSI indicator is suggesting further weakness ahead, although at current levels, history does show a recovery. Volume is presently below average, but is not giving direction either way. |
| Conclusion Teva looks weak on both daily and weekly charts, and could be a possible short over the short-term. I would wait for a break below $52.12 before taking the position. Do note that any move above $59.41 does suggest that Wave-V is not complete, and could be forming a rising wedge topping out at much higher levels. |
Has been a technical analyst since 1969, and has worked as a futures and options trader with First Financial Futures in Johannesburg, South Africa.
| Address: | 3256 West 24th Ave |
| Vancouver, BC | |
| Phone # for sales: | 6042634214 |
| E-mail address: | petroosp@gmail.com |
Click here for more information about our publications!
Comments
Date: 08/05/03Rank: 4Comment:

|

Request Information From Our Sponsors
- StockCharts.com, Inc.
- Candle Patterns
- Candlestick Charting Explained
- Intermarket Technical Analysis
- John Murphy on Chart Analysis
- John Murphy's Chart Pattern Recognition
- John Murphy's Market Message
- MurphyExplainsMarketAnalysis-Intermarket Analysis
- MurphyExplainsMarketAnalysis-Visual Analysis
- StockCharts.com
- Technical Analysis of the Financial Markets
- The Visual Investor
- VectorVest, Inc.
- Executive Premier Workshop
- One-Day Options Course
- OptionsPro
- Retirement Income Workshop
- Sure-Fire Trading Systems (VectorVest, Inc.)
- Trading as a Business Workshop
- VectorVest 7 EOD
- VectorVest 7 RealTime/IntraDay
- VectorVest AutoTester
- VectorVest Educational Services
- VectorVest OnLine
- VectorVest Options Analyzer
- VectorVest ProGraphics v6.0
- VectorVest ProTrader 7
- VectorVest RealTime Derby Tool
- VectorVest Simulator
- VectorVest Variator
- VectorVest Watchdog
