HOT TOPICS LIST
- MACD
- Fibonacci
- RSI
- Gann
- ADXR
- Stochastics
- Volume
- Triangles
- Futures
- Cycles
- Volatility
- ZIGZAG
- MESA
- Retracement
- Aroon
INDICATORS LIST
LIST OF TOPICS
PRINT THIS ARTICLE
by Gary Grosschadl
The daily chart shows several reasons why a bounce attempt looks good here for this major drug manufacturer.
Position: Buy
Gary Grosschadl
Independent Canadian equities trader and technical analyst based in Peterborough
Ontario, Canada.
PRINT THIS ARTICLE
CHART ANALYSIS
Merck & Co. Good To Bounce
07/28/03 10:28:34 AMby Gary Grosschadl
The daily chart shows several reasons why a bounce attempt looks good here for this major drug manufacturer.
Position: Buy
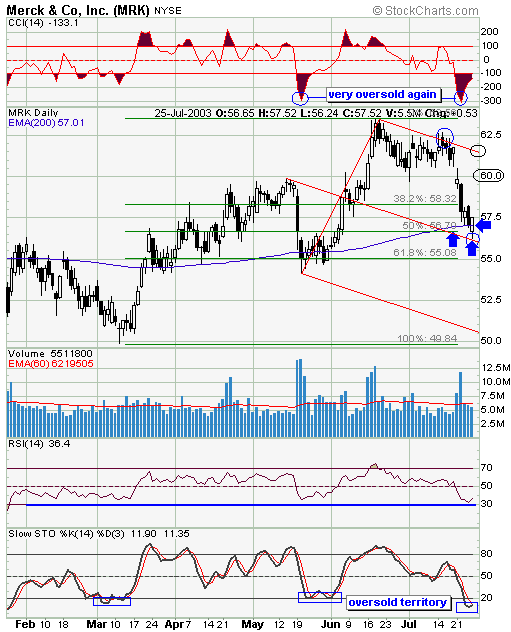
| The daily chart has a pitchfork drawn to show recent price action behavior. Using the three pivot points as shown, trendlines are established via three parallel lines. What is shown is a classic move to the median line (center pitchfork tine) after a retest of the upper median line. This can be a likely area of support in pitchfork theory. |
| Several other technical factors also suggest the likelihood of a bounce. The 200-day EMA has held previous support several times and now is in position to repeat. Also a main Fibonacci retracement level has been touched, that being the 50% level at $56.70. This is measured between the high and low of the chart. |

|
| Merck daily chart with pitchfork and Fibonacci levels. |
| Graphic provided by: Stockcharts.com. |
| |
| Indicator analysis also shows several promising signs of a turnaround here. At the top of the chart the CCI or commodity channel index shows the stock at a very oversold level once again and this hints at a good bounce probability. In a similar fashion, stochastics also shows a movement deep into oversold territory. Stochastic upturns from the 20 area often herald the beginning of an upleg. The RSI or relative strength index (a momentum oscillator that compares the magnitude of gains against the magnitude of losses) shows a bounce off the 30 level which in the past has resulted in sizeable uplegs. |
| Should this possible upleg confirm with additional bullish movement, three upside resistance tests or targets are suggested. The first test may come from the 38.2% ($58.32) Fibonacci level which coincides with several strategic prior candlestick points. The $60 level represents previous support and resistance as well as a gap area so this will likely be an important area to monitor for a change in short term trend. A very bullish move from current levels could see the stock challenge the upper median line or top pitchfork tine. |
| In the short term a bounce is likely but the pitchfork has a downward bias in the longer term so traders should be alert for any reversals especially near the levels discussed. |
Independent Canadian equities trader and technical analyst based in Peterborough
Ontario, Canada.
| Website: | www.whatsonsale.ca/financial.html |
| E-mail address: | gwg7@sympatico.ca |
Click here for more information about our publications!
Comments
Date: 07/29/03Rank: 3Comment:

|

Request Information From Our Sponsors
- StockCharts.com, Inc.
- Candle Patterns
- Candlestick Charting Explained
- Intermarket Technical Analysis
- John Murphy on Chart Analysis
- John Murphy's Chart Pattern Recognition
- John Murphy's Market Message
- MurphyExplainsMarketAnalysis-Intermarket Analysis
- MurphyExplainsMarketAnalysis-Visual Analysis
- StockCharts.com
- Technical Analysis of the Financial Markets
- The Visual Investor
- VectorVest, Inc.
- Executive Premier Workshop
- One-Day Options Course
- OptionsPro
- Retirement Income Workshop
- Sure-Fire Trading Systems (VectorVest, Inc.)
- Trading as a Business Workshop
- VectorVest 7 EOD
- VectorVest 7 RealTime/IntraDay
- VectorVest AutoTester
- VectorVest Educational Services
- VectorVest OnLine
- VectorVest Options Analyzer
- VectorVest ProGraphics v6.0
- VectorVest ProTrader 7
- VectorVest RealTime Derby Tool
- VectorVest Simulator
- VectorVest Variator
- VectorVest Watchdog
