HOT TOPICS LIST
- MACD
- Fibonacci
- RSI
- Gann
- ADXR
- Stochastics
- Volume
- Triangles
- Futures
- Cycles
- Volatility
- ZIGZAG
- MESA
- Retracement
- Aroon
INDICATORS LIST
LIST OF TOPICS
PRINT THIS ARTICLE
by David Penn
The payoff was swift for bears circling around the double top in lean hog futures.
Position: N/A
David Penn
Technical Writer for Technical Analysis of STOCKS & COMMODITIES magazine, Working-Money.com, and Traders.com Advantage.
PRINT THIS ARTICLE
DOUBLE TOPS
A Double Top In October Hogs
07/24/03 12:17:42 PMby David Penn
The payoff was swift for bears circling around the double top in lean hog futures.
Position: N/A
| While the double top in wheat I mentioned in a previous Traders.com Advantage article ("An Intermediate Double Top in September Wheat," June 26, 2003) did not break down as anticipated (more on THAT in an upcoming article), another double top appears to have worked out in picture-perfect fashion for those traders observant enough to take advantage. |
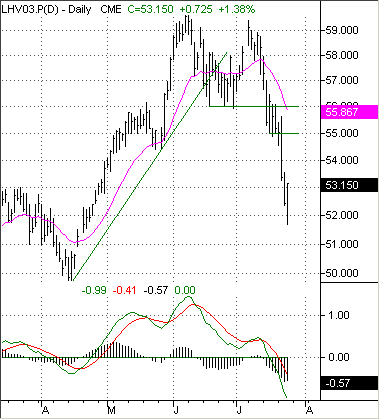
| The double top I have in mind is the one that developed in lean hog futures-- particularly the October lean hogs contract-- over the six weeks from June to mid-July. This double top arrived as the culmination of a bull market that began back in February, with October futures priced as low as 49 cents. After rallying to about 53 cents in March, lean hogs fell to a low of 50 cents in April. This higher low in October hogs signaled, along with a higher low in the MACD indicator, that lean hog prices were likely headed higher. |

|
| A breakdown beneath support, a negative divergence in the MACD and a sharply downward 20-day EMA all point to a rout in lean hog futures. |
| Graphic provided by: TradeStation. |
| |
| And head higher they did. From a low of 50 cents in early April, October lean hogs soared to a high over 59 cents by late May. Correcting over the month of June, hogs lost about 3 %BD cents before rallying again. However, the late June rally attempt failed in July to reach the highs registered in May and, as prices slid rapidly, the double top in October lean hogs began to form. |
| Double tops are reversal patterns that occur after significant advances in all time frames-- from 5-minute charts to long-term monthly charts. It is after the second rally attempt in a double top that sentiment begins to shift as those who had pinned their hopes on taking out the high of the first peak in the double top begin to withdraw from the market. Short-sellers enter the market at this time, realizing that the failure to best the previous high will result in a dearth of buyers willing to continue to bid prices up. |
| How far should October hog prices fall? The downside measurement rule for double tops is a classic use of Stan Weinstein's swing rule, which sees areas of support or resistance almost like hinges around which price extremes swing. In other words, a low 10 points below a significant resistance point suggests a high at least 10 points above the resistance point if prices do in fact break through resistance. Here, in the case of the October lean hogs contract, the high is approximately 59 %BD cents and the support level is at 56 cents. This points to a swing of 3 %BD cents which, when subtracted from the support level gives us a minimum downside projection of 52 %BD from the double top. |
Technical Writer for Technical Analysis of STOCKS & COMMODITIES magazine, Working-Money.com, and Traders.com Advantage.
| Title: | Technical Writer |
| Company: | Technical Analysis, Inc. |
| Address: | 4757 California Avenue SW |
| Seattle, WA 98116 | |
| Phone # for sales: | 206 938 0570 |
| Fax: | 206 938 1307 |
| Website: | www.Traders.com |
| E-mail address: | DPenn@traders.com |
Traders' Resource Links | |
| Charting the Stock Market: The Wyckoff Method -- Books | |
| Working-Money.com -- Online Trading Services | |
| Traders.com Advantage -- Online Trading Services | |
| Technical Analysis of Stocks & Commodities -- Publications and Newsletters | |
| Working Money, at Working-Money.com -- Publications and Newsletters | |
| Traders.com Advantage -- Publications and Newsletters | |
| Professional Traders Starter Kit -- Software | |
Click here for more information about our publications!
PRINT THIS ARTICLE

|

Request Information From Our Sponsors
- StockCharts.com, Inc.
- Candle Patterns
- Candlestick Charting Explained
- Intermarket Technical Analysis
- John Murphy on Chart Analysis
- John Murphy's Chart Pattern Recognition
- John Murphy's Market Message
- MurphyExplainsMarketAnalysis-Intermarket Analysis
- MurphyExplainsMarketAnalysis-Visual Analysis
- StockCharts.com
- Technical Analysis of the Financial Markets
- The Visual Investor
- VectorVest, Inc.
- Executive Premier Workshop
- One-Day Options Course
- OptionsPro
- Retirement Income Workshop
- Sure-Fire Trading Systems (VectorVest, Inc.)
- Trading as a Business Workshop
- VectorVest 7 EOD
- VectorVest 7 RealTime/IntraDay
- VectorVest AutoTester
- VectorVest Educational Services
- VectorVest OnLine
- VectorVest Options Analyzer
- VectorVest ProGraphics v6.0
- VectorVest ProTrader 7
- VectorVest RealTime Derby Tool
- VectorVest Simulator
- VectorVest Variator
- VectorVest Watchdog
