HOT TOPICS LIST
- MACD
- Fibonacci
- RSI
- Gann
- ADXR
- Stochastics
- Volume
- Triangles
- Futures
- Cycles
- Volatility
- ZIGZAG
- MESA
- Retracement
- Aroon
INDICATORS LIST
LIST OF TOPICS
PRINT THIS ARTICLE
by Kevin Hopson
EnCana Corp. (ECA) has been pulling back since the early part of June but looks to be forming a short-term bottom at current levels.
Position: Accumulate
Kevin Hopson
Kevin has been a technical analyst for roughly 10 years now. Previously, Kevin owned his own business and acted as a registered investment advisor, specializing in energy. He was also a freelance oil analyst for Orient Trading Co., a commodity futures trading firm in Japan. Kevin is currently a freelance writer.
PRINT THIS ARTICLE
TECHNICAL ANALYSIS
Is EnCana Corp. Ready To Turn Around?
07/24/03 08:58:42 AMby Kevin Hopson
EnCana Corp. (ECA) has been pulling back since the early part of June but looks to be forming a short-term bottom at current levels.
Position: Accumulate
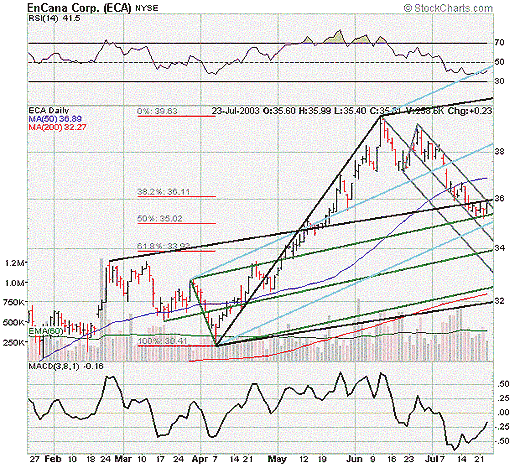
| EnCana Corp. (ECA) is an oil and gas exploration and production company with primary operations in Western Canada, offshore Canada's East Coast, the U.S. Rocky Mountains and the Gulf of Mexico. EnCana also operates outside of North America in Ecuador and the North Sea. Technically speaking, EnCana - much like the rest of its peers - has been in a corrective mode since early to mid-June. However, similar to most other companies I have been watching in the oil and gas sector, the stock is seeing some bullish divergences on the chart. |
| For example, if you look at EnCana's six-month chart, you will notice that the relative strength index (RSI) has been flattening out the last couple weeks, while the moving average convergence/divergence (MACD) has been moving higher. This comes during a time when the stock price has continued to move lower. As a result, EnCana could be putting in a short-term bottom at current levels. |

|
| Graphic provided by: Stockcharts.com. |
| |
| However, if the short-term trend is going to change, a couple things must first take place. For one, EnCana has to break near-term resistance around the $36.00 level. Notice how the stock has been contained within the top channel of the gray pitchfork since late June. The top parallel line (or June's downtrend line) has capped prices since then and is now intersecting with the black median line. The combination of these two trendlines is causing resistance around the $36.00 level. Secondly, the MACD must move above zero. This usually signals a positive change in the short-term trend and would help confirm a move to the upside. |
| Even if EnCana fails to breach the $36.00 level in the near-term, there appears to be a confluence of support in the $35.00 to $35.20 range. More specifically, notice how the stock is currently finding support along the top green parallel line. Additionally, the bottom blue parallel line and the 50 percent retracement level ($35.02) from the April-June rally are also coming into play. With short interest remaining high, at over 7.0x normal daily volume, I would look to accumulate shares of EnCana on any near-term price weakness. |
Kevin has been a technical analyst for roughly 10 years now. Previously, Kevin owned his own business and acted as a registered investment advisor, specializing in energy. He was also a freelance oil analyst for Orient Trading Co., a commodity futures trading firm in Japan. Kevin is currently a freelance writer.
| Glen Allen, VA | |
| E-mail address: | hopson_1@yahoo.com |
Click here for more information about our publications!
PRINT THIS ARTICLE

Request Information From Our Sponsors
- StockCharts.com, Inc.
- Candle Patterns
- Candlestick Charting Explained
- Intermarket Technical Analysis
- John Murphy on Chart Analysis
- John Murphy's Chart Pattern Recognition
- John Murphy's Market Message
- MurphyExplainsMarketAnalysis-Intermarket Analysis
- MurphyExplainsMarketAnalysis-Visual Analysis
- StockCharts.com
- Technical Analysis of the Financial Markets
- The Visual Investor
- VectorVest, Inc.
- Executive Premier Workshop
- One-Day Options Course
- OptionsPro
- Retirement Income Workshop
- Sure-Fire Trading Systems (VectorVest, Inc.)
- Trading as a Business Workshop
- VectorVest 7 EOD
- VectorVest 7 RealTime/IntraDay
- VectorVest AutoTester
- VectorVest Educational Services
- VectorVest OnLine
- VectorVest Options Analyzer
- VectorVest ProGraphics v6.0
- VectorVest ProTrader 7
- VectorVest RealTime Derby Tool
- VectorVest Simulator
- VectorVest Variator
- VectorVest Watchdog
