HOT TOPICS LIST
- MACD
- Fibonacci
- RSI
- Gann
- ADXR
- Stochastics
- Volume
- Triangles
- Futures
- Cycles
- Volatility
- ZIGZAG
- MESA
- Retracement
- Aroon
INDICATORS LIST
LIST OF TOPICS
PRINT THIS ARTICLE
by David Penn
A negative divergence in the MACD and a broken trendline conspire to send natural gas futures reeling.
Position: N/A
David Penn
Technical Writer for Technical Analysis of STOCKS & COMMODITIES magazine, Working-Money.com, and Traders.com Advantage.
PRINT THIS ARTICLE
MACD
The Summer Correction In Natural Gas
07/24/03 08:26:03 AMby David Penn
A negative divergence in the MACD and a broken trendline conspire to send natural gas futures reeling.
Position: N/A
| Maybe it was seeing one of the part-time clerical workers downstairs here at Technical Analysis, Inc. scurrying about looking for information on "natural gas stocks." Maybe, as I suggested a little over a month ago ("Is It 'Now Time' for Natural Gas?," Traders.com Advantage, June 19, 2003), it was Greenspan's jawboning of the House Energy and Commerce committee-- or the alarmist headlines about the radical shortage of natural gas. As I said at the time, I have no idea whether or not there is a shortage of natural gas. But there are times when you can see a commodity top a mile away and mid-June was one of those times. |

|
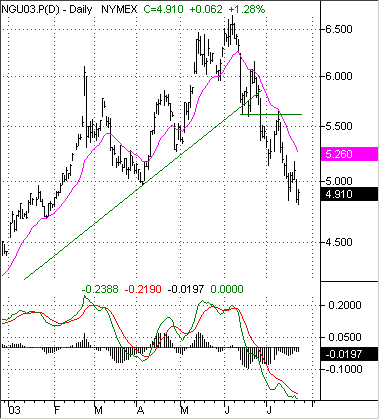
| Figure 1: After soaring to more than $6.50 in early June, natural gas futures (basis September) plunged to below $5.00 less than two months later. Note the negative divergence between the MACD troughs in mid-May and early June, and price action in the futures. |
| Graphic provided by: TradeStation. |
| |
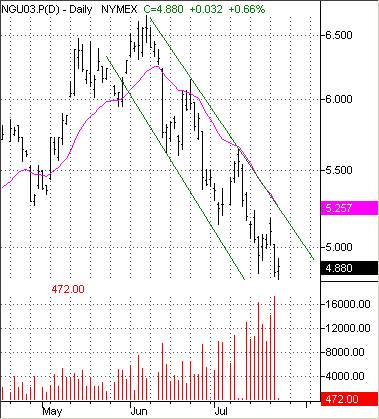
| The summer correction in natural gas futures was anticipated by a number of technical developments-- as I pointed out last month-- ranging from a trendline break to a "dead-cat bounce" in the Herrick Payoff Index (HPI). To this list we can add the negative divergence in the moving average convergence/divergence that took place between mid-May and mid-June. Although there have been a pair of sharp countertrend rallies, natural gas (basis September) has moved down swiftly and resolutely from its highs in early June. As Figure 2 shows, the downtrend in natural gas has remained within a well-defined trend channel of lower highs and lower lows. |
 Figure 2: This trend channel has contained 100% of the price action since the decline in natural gas began in early June. How does the current bear market in natural gas futures resolve itself? At current levels, September natural gas is in the neighborhood of some significant support around $5. This support comes in the form of the April lows-- which represented the launching pad for natural gas' push above $6.50. The growing volume in the present decline is also significant, suggesting that natural gas may be nearing a point at which the intensity of selling finally exhausts itself. As such a point nears, bargain buyers and shorts looking to cover what should have been exceptionally profitable selling over the past few weeks should begin to emerge, pushing natural gas prices back upward. |
Technical Writer for Technical Analysis of STOCKS & COMMODITIES magazine, Working-Money.com, and Traders.com Advantage.
| Title: | Technical Writer |
| Company: | Technical Analysis, Inc. |
| Address: | 4757 California Avenue SW |
| Seattle, WA 98116 | |
| Phone # for sales: | 206 938 0570 |
| Fax: | 206 938 1307 |
| Website: | www.Traders.com |
| E-mail address: | DPenn@traders.com |
Traders' Resource Links | |
| Charting the Stock Market: The Wyckoff Method -- Books | |
| Working-Money.com -- Online Trading Services | |
| Traders.com Advantage -- Online Trading Services | |
| Technical Analysis of Stocks & Commodities -- Publications and Newsletters | |
| Working Money, at Working-Money.com -- Publications and Newsletters | |
| Traders.com Advantage -- Publications and Newsletters | |
| Professional Traders Starter Kit -- Software | |
Click here for more information about our publications!
Comments
Date: 08/05/03Rank: 5Comment:

Request Information From Our Sponsors
- StockCharts.com, Inc.
- Candle Patterns
- Candlestick Charting Explained
- Intermarket Technical Analysis
- John Murphy on Chart Analysis
- John Murphy's Chart Pattern Recognition
- John Murphy's Market Message
- MurphyExplainsMarketAnalysis-Intermarket Analysis
- MurphyExplainsMarketAnalysis-Visual Analysis
- StockCharts.com
- Technical Analysis of the Financial Markets
- The Visual Investor
- VectorVest, Inc.
- Executive Premier Workshop
- One-Day Options Course
- OptionsPro
- Retirement Income Workshop
- Sure-Fire Trading Systems (VectorVest, Inc.)
- Trading as a Business Workshop
- VectorVest 7 EOD
- VectorVest 7 RealTime/IntraDay
- VectorVest AutoTester
- VectorVest Educational Services
- VectorVest OnLine
- VectorVest Options Analyzer
- VectorVest ProGraphics v6.0
- VectorVest ProTrader 7
- VectorVest RealTime Derby Tool
- VectorVest Simulator
- VectorVest Variator
- VectorVest Watchdog
