HOT TOPICS LIST
- MACD
- Fibonacci
- RSI
- Gann
- ADXR
- Stochastics
- Volume
- Triangles
- Futures
- Cycles
- Volatility
- ZIGZAG
- MESA
- Retracement
- Aroon
INDICATORS LIST
LIST OF TOPICS
PRINT THIS ARTICLE
by David Penn
Would a steep pullback in the S&P 500 set the stage for a resumption of the bull market?
Position: N/A
David Penn
Technical Writer for Technical Analysis of STOCKS & COMMODITIES magazine, Working-Money.com, and Traders.com Advantage.
PRINT THIS ARTICLE
MACD
Revisiting The Triple Bottom Breakout
07/22/03 12:07:21 PMby David Penn
Would a steep pullback in the S&P 500 set the stage for a resumption of the bull market?
Position: N/A
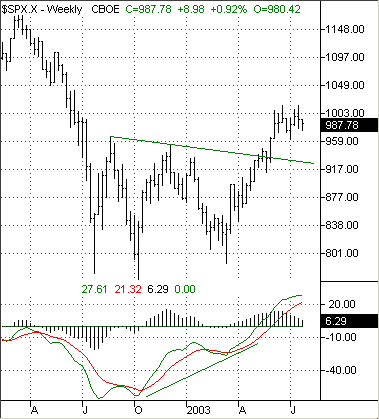
| I became a believer in the spring/summer 2003 bull market in early June, when the S&P 500 confirmed both a positive MACD divergence as well as a breakout from a triple bottom formation that stretched back to last July. With the market currently teetering between fear and greed, it is worth noting that the consolidation that forms the base of the present bull market is now more than a year long. This alone suggests that the current rally, which is just over fourth months long, could easily have a few more months left before it is done. The rally off the post-September 11th lows lasted approximately six months into the spring of 2002-- as did the initial rally off the April 2000 lows. |
| Interestingly, in both the April-September 2000 and September-March 2001 six-month rallies, it was the fourth month that proved to be among the most difficult. The current rally that began in mid-March 2003 is also ending its fifth month, so it should perhaps be no surprise that the price gains in June and July have been more difficult to come by than those in April and May. |

|
| Figure 1: A positive MACD divergence and a breakout above the highs of the three troughs was bullish for the S&P 500 late in the second quarter of 2003. |
| Graphic provided by: TradeStation. |
| |
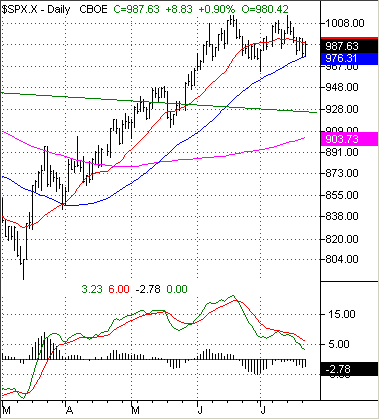
| The question now is whether or not the markets will continue to move up. While many factors continue to point toward further gains, a look at the daily chart suggests that a short-term pullback might not only be likely, but also may be healthy and helpful for those looking to see higher prices in the S&P 500 over the next few months. |
 Figure 2: A negative MACD divergence points toward the S&P 500 moving lower. For how long will the 50-day moving average provide support? The same MACD that provided such a strong clue that the S&P 500 was headed higher (see my article "The S&P 500's MACD Triple Bottom Breakout," Traders.com Advantage, June 9, 2003), now seems to be indicating that the S&P 500 may be headed lower. Whereas the June and July peaks in price are approximately at the same height, the two peaks are decidedly different in the MACD, with the June MACD peak towering over the July MACD peak. This appears to represent a negative divergence between price action and the indicator, with the likely result that prices will move to confirm the bearishness of the indicator. If the S&P 500 does correct, then to what extent might it do so? Most immediately, it appears that the S&P 500 could make a swing low to around 920. This swing low is derived using Stan Weinstein's formulation in his book, "Secrets to Profiting in Bull and Bear Markets." Applied here, it involves taking the value at the current peak of what looks now to be a double top in the S&P 500, and subtracting from that value that value at the inter-peak low. This is approximately 1014-967, which yields a potential drop beneath support of 47 points. Such a drop from the support level at 967 gives the 920 projection. |
| However, such a decline could-- in the larger context-- actually merely represent a pullback from the breakout from the year-long triple bottom formation. With the neckline, which does slope downward, at about 928-- as well as some possible support from the May lows, it is easy to conceive of a scenario in which the S&P 500 does in fact break down, but finds its descent stopped in the neighborhood of its previous breakout-- give or take a few points. The projection from the triple bottom breakout, as I noted in early June, was around 1140 (in the earlier piece mentioned above, prices on the breakout day closed at 945, but the breakout point was lower at 933. The S&P 500's farthest extent in this bull market is 1014, which suggests that, if the triple bottom projection is accurate, the S&P 500 has more than a hundred points to go-- and moreso at recent levels (below 990). Given the near perfection of the bull market since March 2003, is it hard to imagine the market making such a big run on the heels of a truly bear-baiting correction? |
Technical Writer for Technical Analysis of STOCKS & COMMODITIES magazine, Working-Money.com, and Traders.com Advantage.
| Title: | Technical Writer |
| Company: | Technical Analysis, Inc. |
| Address: | 4757 California Avenue SW |
| Seattle, WA 98116 | |
| Phone # for sales: | 206 938 0570 |
| Fax: | 206 938 1307 |
| Website: | www.Traders.com |
| E-mail address: | DPenn@traders.com |
Traders' Resource Links | |
| Charting the Stock Market: The Wyckoff Method -- Books | |
| Working-Money.com -- Online Trading Services | |
| Traders.com Advantage -- Online Trading Services | |
| Technical Analysis of Stocks & Commodities -- Publications and Newsletters | |
| Working Money, at Working-Money.com -- Publications and Newsletters | |
| Traders.com Advantage -- Publications and Newsletters | |
| Professional Traders Starter Kit -- Software | |
Click here for more information about our publications!
Comments
Date: 08/05/03Rank: 3Comment:

Request Information From Our Sponsors
- StockCharts.com, Inc.
- Candle Patterns
- Candlestick Charting Explained
- Intermarket Technical Analysis
- John Murphy on Chart Analysis
- John Murphy's Chart Pattern Recognition
- John Murphy's Market Message
- MurphyExplainsMarketAnalysis-Intermarket Analysis
- MurphyExplainsMarketAnalysis-Visual Analysis
- StockCharts.com
- Technical Analysis of the Financial Markets
- The Visual Investor
- VectorVest, Inc.
- Executive Premier Workshop
- One-Day Options Course
- OptionsPro
- Retirement Income Workshop
- Sure-Fire Trading Systems (VectorVest, Inc.)
- Trading as a Business Workshop
- VectorVest 7 EOD
- VectorVest 7 RealTime/IntraDay
- VectorVest AutoTester
- VectorVest Educational Services
- VectorVest OnLine
- VectorVest Options Analyzer
- VectorVest ProGraphics v6.0
- VectorVest ProTrader 7
- VectorVest RealTime Derby Tool
- VectorVest Simulator
- VectorVest Variator
- VectorVest Watchdog
