HOT TOPICS LIST
- MACD
- Fibonacci
- RSI
- Gann
- ADXR
- Stochastics
- Volume
- Triangles
- Futures
- Cycles
- Volatility
- ZIGZAG
- MESA
- Retracement
- Aroon
INDICATORS LIST
LIST OF TOPICS
PRINT THIS ARTICLE
by Gary Grosschadl
The gold price made a sizeable upswing from April to June where it ran from $322 - $375. After a healthy retracement, it may be ready to climb back up.
Position: Buy
Gary Grosschadl
Independent Canadian equities trader and technical analyst based in Peterborough
Ontario, Canada.
PRINT THIS ARTICLE
CHART ANALYSIS
New Gold Upleg?
07/24/03 10:21:05 AMby Gary Grosschadl
The gold price made a sizeable upswing from April to June where it ran from $322 - $375. After a healthy retracement, it may be ready to climb back up.
Position: Buy
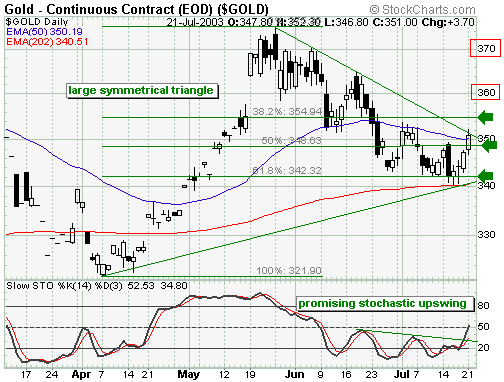
| This daily chart shows a large symmetrical triangle which is a neutral pattern until it breaks one way or the other. While not a perfect symmetrical triangle (more tests of the lower trendline in May or June would have been preferable), my contention is that there are several indications of a likely upside break. |
| The two moving averages shown in the chart below do a good job of explaining recent trading action. The 50-day EMA held brief support when the price of gold declined in June and the gold price ran back to the upper trendline only to be turned back again. What ensued then was a decisive break below the 50-day EMA. Previous support had turned into resistance as that EMA was tested several times. Now this level is being challenged again as the price of gold has managed a close just above $350. |

|
| Gold price daily chart. |
| Graphic provided by: Stockcharts.com. |
| |
| The question now is, does this signal a coming advance past the upper trendline? Besides the initial move above the 50-day EMA there are other indications that a bullish move may be starting. Note the location of the 200-day EMA -- it coincides with the bottom trendline. This often meaningful moving average can launch powerful reversals either way and the price of gold has just managed a bounce off of it. |
| The chart also shows the more common Fibonacci retracement levels (green arrows). The move down to the $340 level satisfies the 61.8% level and a recovery from here is likely anticipated by Fibonacci traders. The move up from there has now exceeded the next Fibonacci level of 50% at 348.63. This hints at a bullish move to the next mark at $355. A successful push past this level brings the $360 and $370 targets into play. |
| The stochastics indicator also shows some bullish encouragement. A trendline drawn on the graph shows that something more bullish is occuring here. Previous upswings have not reached the 50 level and now we are just breaching this level. This 50 level should be carefully watched as it can be a stall point. However a move past this level will be interpreted as very bullish by some technical traders. I am bullish on gold stocks provided that the price of gold holds above $350. |
Independent Canadian equities trader and technical analyst based in Peterborough
Ontario, Canada.
| Website: | www.whatsonsale.ca/financial.html |
| E-mail address: | gwg7@sympatico.ca |
Click here for more information about our publications!
Comments
Date: 07/29/03Rank: 3Comment:
Date: 08/05/03Rank: 5Comment:

Request Information From Our Sponsors
- StockCharts.com, Inc.
- Candle Patterns
- Candlestick Charting Explained
- Intermarket Technical Analysis
- John Murphy on Chart Analysis
- John Murphy's Chart Pattern Recognition
- John Murphy's Market Message
- MurphyExplainsMarketAnalysis-Intermarket Analysis
- MurphyExplainsMarketAnalysis-Visual Analysis
- StockCharts.com
- Technical Analysis of the Financial Markets
- The Visual Investor
- VectorVest, Inc.
- Executive Premier Workshop
- One-Day Options Course
- OptionsPro
- Retirement Income Workshop
- Sure-Fire Trading Systems (VectorVest, Inc.)
- Trading as a Business Workshop
- VectorVest 7 EOD
- VectorVest 7 RealTime/IntraDay
- VectorVest AutoTester
- VectorVest Educational Services
- VectorVest OnLine
- VectorVest Options Analyzer
- VectorVest ProGraphics v6.0
- VectorVest ProTrader 7
- VectorVest RealTime Derby Tool
- VectorVest Simulator
- VectorVest Variator
- VectorVest Watchdog
