

HOT TOPICS LIST
- MACD
- Fibonacci
- RSI
- Gann
- ADXR
- Stochastics
- Volume
- Triangles
- Futures
- Cycles
- Volatility
- ZIGZAG
- MESA
- Retracement
- Aroon
INDICATORS LIST
LIST OF TOPICS
PRINT THIS ARTICLE
by Gary Grosschadl
AOL has enjoyed a good rise the past few months but is now looking a little tired.
Position: Sell
Gary Grosschadl
Independent Canadian equities trader and technical analyst based in Peterborough
Ontario, Canada.
PRINT THIS ARTICLE
CHART ANALYSIS
AOL Early Warning Signs
07/22/03 08:29:52 AMby Gary Grosschadl
AOL has enjoyed a good rise the past few months but is now looking a little tired.
Position: Sell
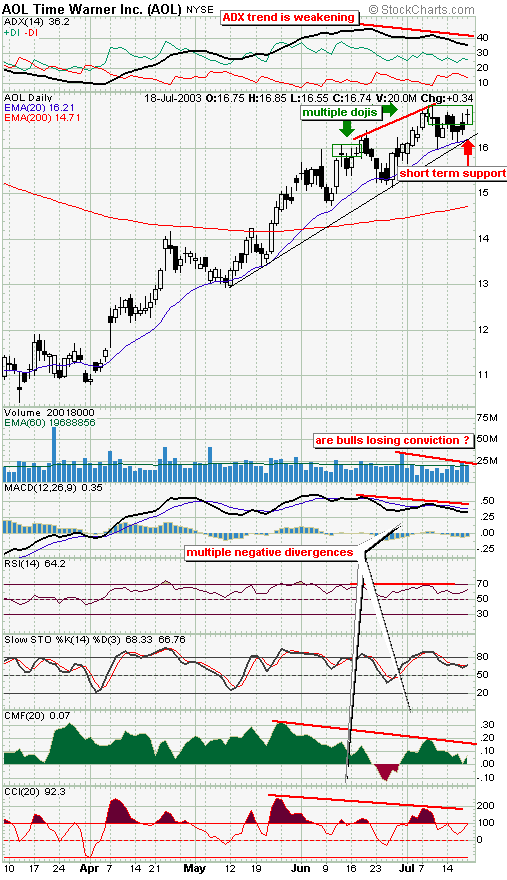
| AOL's short-term uptrend is still intact but several early warning signs have emerged that give reason for concern. The first is the declining volume. When a stock continues to rise on diminishing volume, it often shows less conviction on the part of the bulls, and when fewer bulls support the stock, a decline may not be very far off. |
| The directional movement indicator on the top of the chart shows a declining ADX component. When the ADX peaks and reverses, it reflects a weakening in the trend's strength. If this ADX line continues to weaken it will prompt a bearish crossing of the DI lines. This will shift strength from the bulls to the bears. |
|
| AOL Time Warner daily chart showing multiple negative divergences. |
| Graphic provided by: Stockcharts.com. |
| |
| Several other indicators are also showing negative divergences to price action. CMF or the Chaiken Money Flow indicator is noteworthy among them. CMF differs from most momentum indicators in that it takes price and volume into consideration. In this way it is a measure of supply and demand. As the slope of the trendline on this indicator shows, buying power is diminishing and this is not a healthy sign for a rising stock. |
| Lastly the candlesticks are also a reason for concern. When doji candlesticks appear after an extended rise it is often a warning sign of topping action. Back in June two dojis apperared and even though they were initially ignored a retracement soon followed. These small crosses signify hesitation or a temporary balance between the bulls and bears and this often means a loss of momentum after extended falls or rises. Now in July two more dojis have appeared, again hinting at a possible loss of upward momentum. |
| Whether another small retracement develops that will be halted by the nearby 20-day EMA or trendline as depicted remains to be seen. With all the concerns discussed above, a bigger move down to perhaps the 200-day EMA, currently at $14.71, would not be out of the question. A move south of $16 would certainly send some alarm bells ringing to those closely following this stock. |
Independent Canadian equities trader and technical analyst based in Peterborough
Ontario, Canada.
| Website: | www.whatsonsale.ca/financial.html |
| E-mail address: | gwg7@sympatico.ca |
Click here for more information about our publications!
Comments
Date:�07/22/03Rank:�4Comment:�
Date:�07/24/03Rank:�4Comment:�

Request Information From Our Sponsors
- StockCharts.com, Inc.
- Candle Patterns
- Candlestick Charting Explained
- Intermarket Technical Analysis
- John Murphy on Chart Analysis
- John Murphy's Chart Pattern Recognition
- John Murphy's Market Message
- MurphyExplainsMarketAnalysis-Intermarket Analysis
- MurphyExplainsMarketAnalysis-Visual Analysis
- StockCharts.com
- Technical Analysis of the Financial Markets
- The Visual Investor
- VectorVest, Inc.
- Executive Premier Workshop
- One-Day Options Course
- OptionsPro
- Retirement Income Workshop
- Sure-Fire Trading Systems (VectorVest, Inc.)
- Trading as a Business Workshop
- VectorVest 7 EOD
- VectorVest 7 RealTime/IntraDay
- VectorVest AutoTester
- VectorVest Educational Services
- VectorVest OnLine
- VectorVest Options Analyzer
- VectorVest ProGraphics v6.0
- VectorVest ProTrader 7
- VectorVest RealTime Derby Tool
- VectorVest Simulator
- VectorVest Variator
- VectorVest Watchdog